Alphabet
I present some comments in the light of recent quarterly results. I will not cover the Results in details as that is covered elsewhere extensively .
In a world dominated by very successful large tech companies, the story of Google/ Alphabet is one of the most remarkable. The research done by two PhDs led to a start-up company that was launched in 1998 and today has annual revenues of around US$ 260bn and a market value of US$ 1.3 trillion (US$1,300bn).
In the 1990s, if you wanted to do a search on the internet, you had a choice of a number of search engines such as MSN Search (Microsoft), Alta Vista, Lycos, AlltheWeb and many others. Google Search was launched in 1998 and in a few years, achieved a high market share, which has been around 87% (ex China) for two decades.
A search engine has to quickly try and find the most relevant internet page for a particular search and have some method for ranking them with the most relevant ones at the top. The AltaVista Search engine, for example, determined page relevance by matching site content with the search query, a method that taxed computing resources by more than it improved search quality as the sheer size of the internet grew. There were just too many pages for Alta Vista to look at and try to match.
The founders of Google, Sergey Brin and Larry Page, in their research took a different approach by borrowing the citation approach common in the world of academic research.
Citation has a precise meaning. It is defined “as an abbreviated alphanumeric expression embedded in the body of an intellectual work that denotes an entry in the bibliographic references section of the work for the purpose of acknowledging the relevance of the works of others to the topic of discussion at the spot where the citation appears.”
In academia, a research paper’s ranking is determined by the number of times other academic papers cite it. The greater the number of citations, the higher the rank of the paper.
Google’s algorithm, assigned page values based on the volume and quality of inbound links from other sites (like a voting system among websites). The greater the number of websites that linked to your website, the higher your website would rank in the Google Search Engine Output. Google Search counted the number of links rather than search the individual pages and therefore it benefited from the explosive growth in the internet. The computing power required to do a search on Google did not rise in line with the growth of the internet. Therefore, Google was a much better search engine than Alta Vista and others
Google Search was a feed-back enhanced learning and data gathering machine machine. Each search query would generate a data log. It would record where the was, what the user searched for and which link ( if any) of the ones generated by Google Search was clicked on by the user. This allowed Google to both gather data on the internet user and improve the quality of the search experience. This gave rise to one of the most remarkable flywheels in the history of human commerce.
Definition: The flywheel effect happens when small wins for your business build on each other over time and eventually gain so much momentum that growth almost seems to happen by itself – similar to the momentum created by a flywheel on a rowing machine.
Over the next two and a half decades, as the number of internet users grew to 5 billion who directed 85% (ex-China) of their searches to Google, the search experience improved exponentially (as the algorithm improved on the back of the billions of searches and clicks) and Google collected huge amounts of data on billions of people.
By knowing the location of your devices and your Google search and click history, Google probably know more about you than your spouse!.
Since Search is “free”, how was Google going to make money? The answer was mainly advertising. Traditional advertising and marketing has a very poor business model. The problem was outlined by Lord Leverhulme who was the founder of Lever Brothers (now Unilever) and a major advertiser of consumer products when he said “Half of my advertising is wasted, and the trouble is, I don’t know which half.”
Suppose, a company spends a lot of money on traditional advertising campaign in newspapers and television. They have some data on who the readers or viewers are but the spending is essentially a shot in the dark. You can look at the sales growth after the campaign and try and guess the impact of the advertising but working out the return on investment on the advertising/ marketing spend is essentially guesswork.
Internet advertising is very different. Because of the user data collected by Google, Meta and others, advertising can be targeted in a precise way and its effectiveness can be assessed accurately by looking at the data on where the advertisement was clicked on. This is a much more attractive proposition for somebody looking to spend money on advertising.
With hindsight we can say Google was in a very sweet spot at the time of its IPO in 2004.
The number of people connected to the internet was about to explode as was the size of the internet.
Google was about the become the dominant search engine.
Internet advertising offered a much better product than traditional advertising
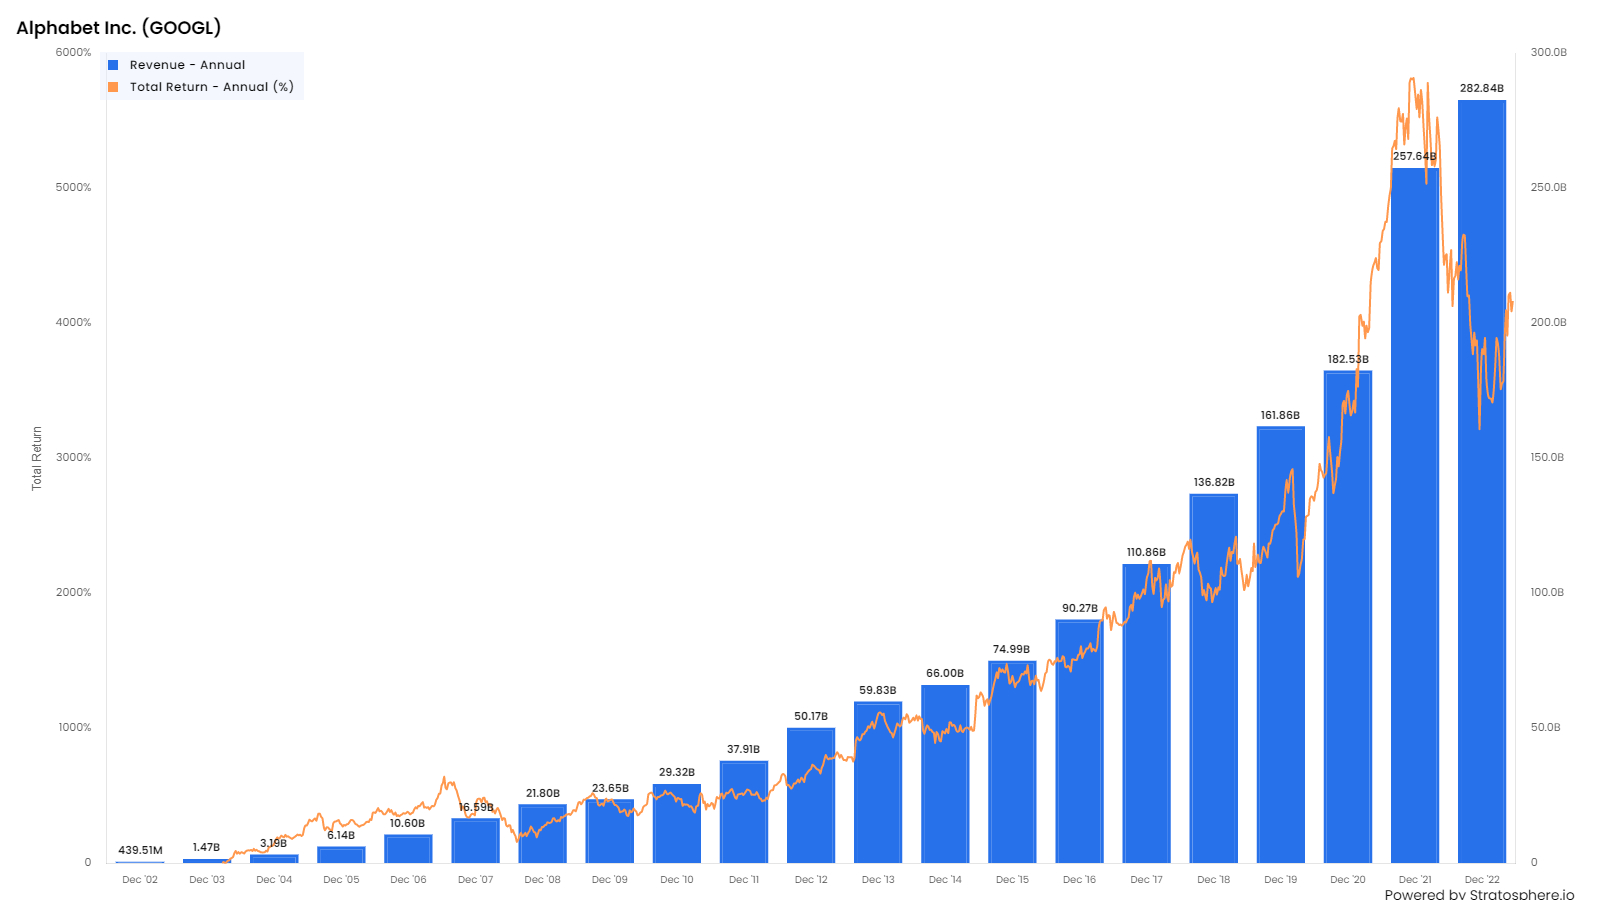
As might be expected, Google grew very strongly in the last twenty years since its IPO as shown below.
Total revenue has grown strongly in the last 30 years. Revenue grew for US% 440mn in 2002 to about US$ 280bn annually currently.
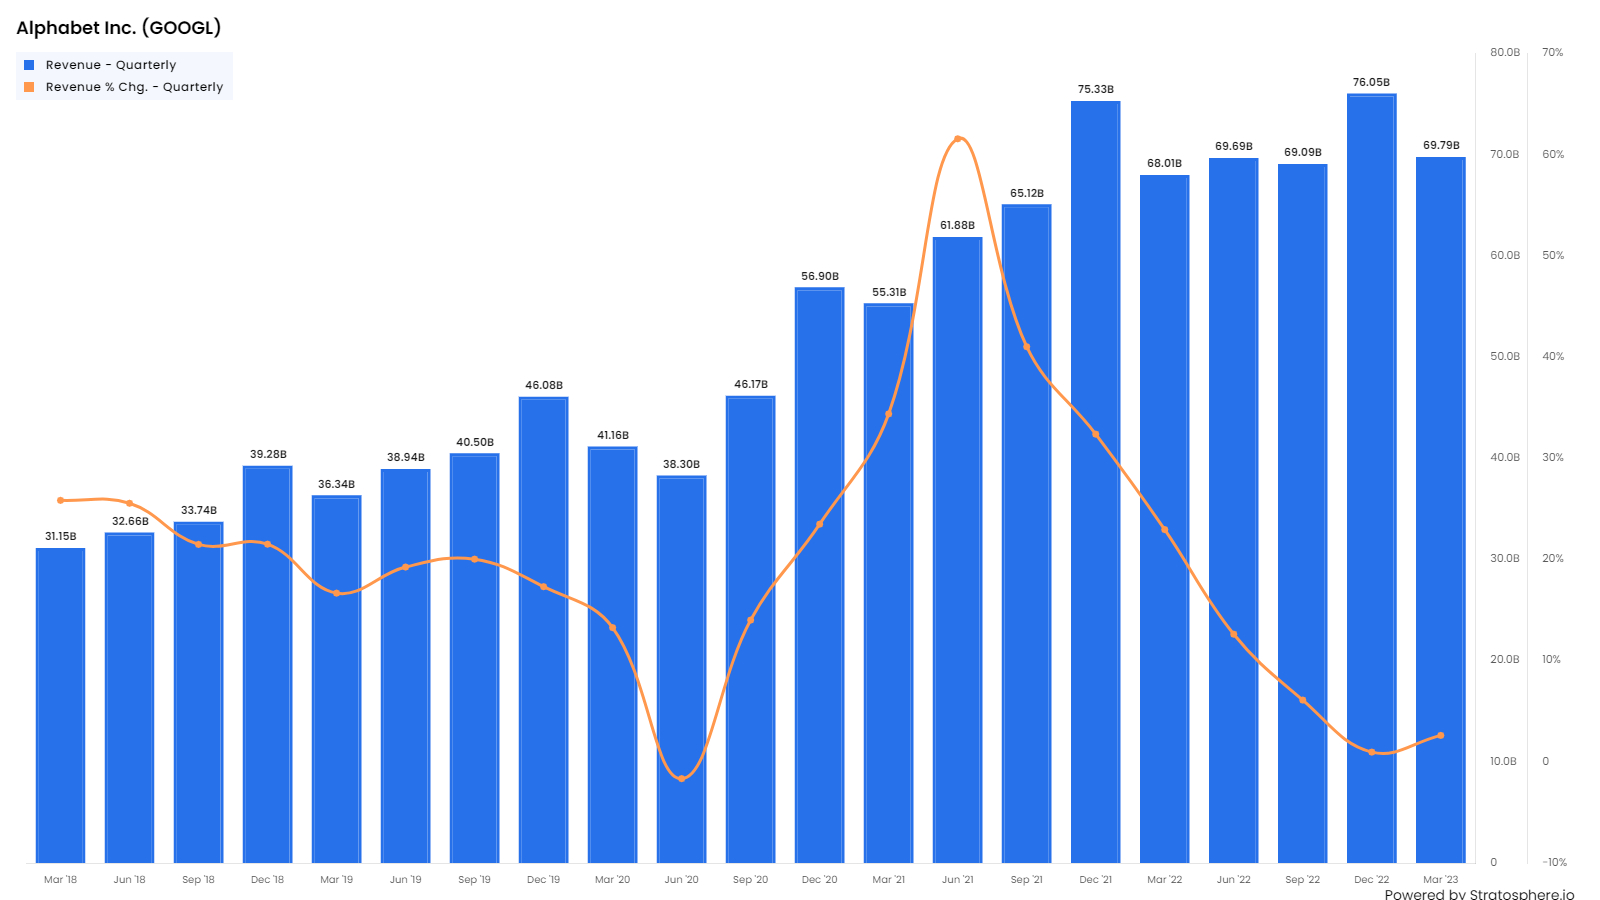
Revenue growth (q-o-q) has been in the range 10% to 30% in the last five years. There was a Covid-19 slowdown in 2020 but a strong 2021 bounce back and then a more prolonged slowdown in 2022/23.
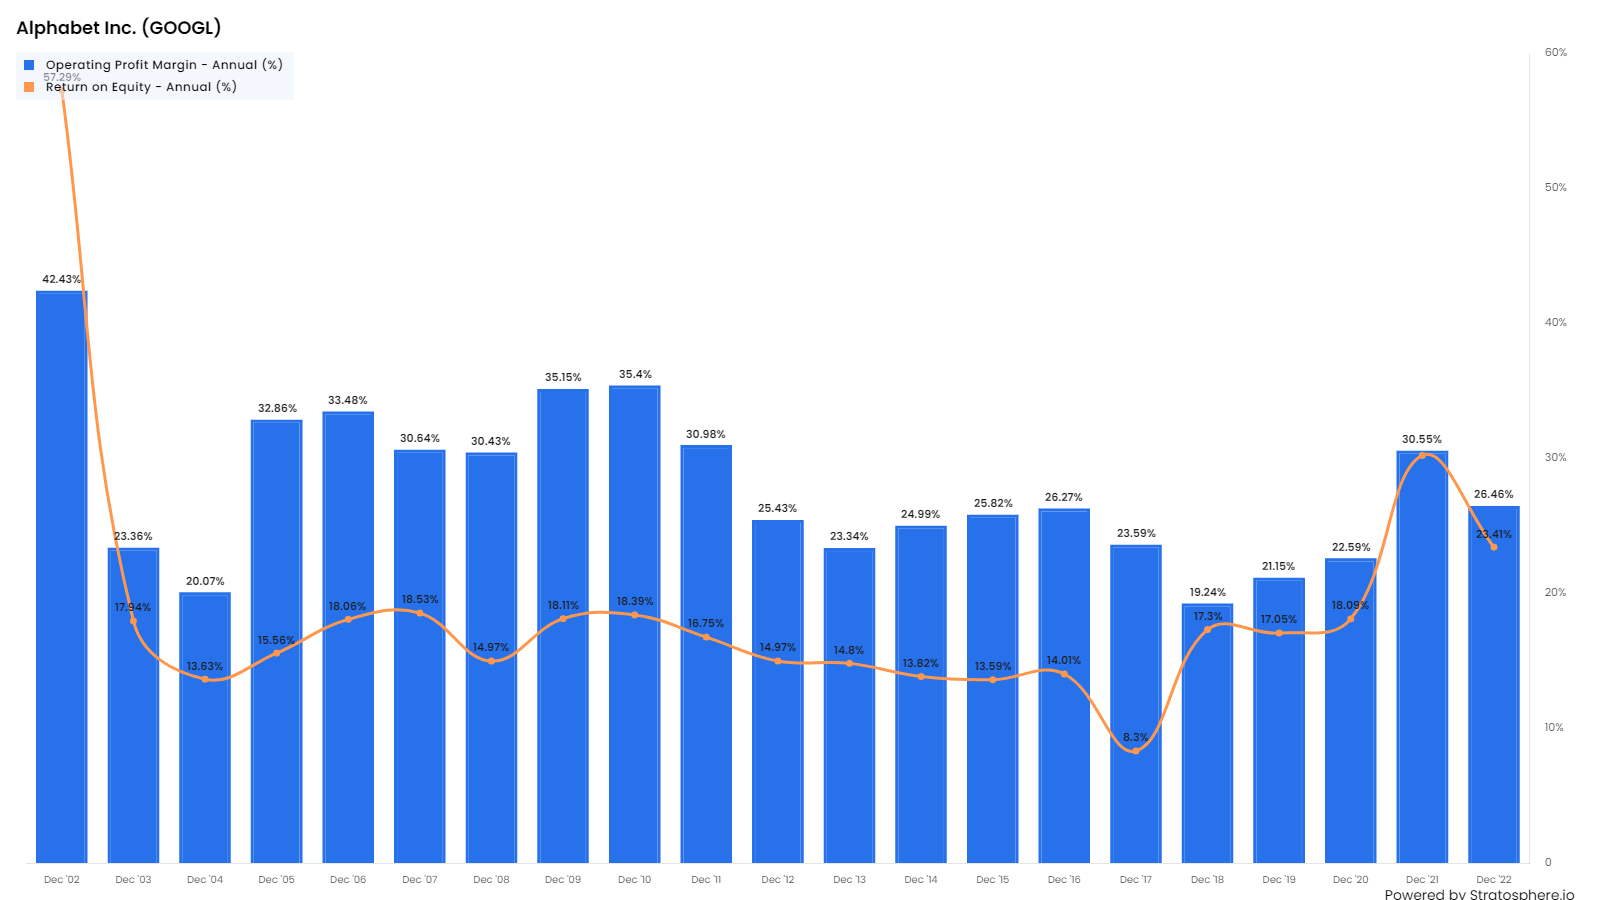
The growth has been consistently profitable with operating margins in the 22% -30% range and Return on Equity in the range of 14% to 20%.
The company has seen a corresponding increase in operating cashflow (current range US$ 20-22bn per quarter) and Free Cash Flow (US15bn to US$ 17bn per quarter).
The difference between the two numbers is capital expenditure and that is currently running at about US$ 3-5bn per quarter or US$ 13bn-US 20bn annually.
The Free Cash Flow level means Google has about US$ 60bn to spend on share buybacks and acquisitions (It does not pay a divided). In the last three year, most of the free cash flow has been used to buyback shares.
Google has a stellar record in acquisitions. The Acquired Podcast listed what they believe to be ten of the greatest ever acquisitions. Four of these have been done by Google. DoubleClick was bought for US$ 3.1bn and is estimated to have returned US$ 182bn (~60X) as of December 2022. The equivalent figures for YouTube are US$1.65bn and160bn (~98x). in percentage terms the highest return comes from Android which cost just US$ 50mn but has returned US$112bn so far ( ~244X)
DoubleClick Inc. was an American advertisement company that developed and provided Internet ad serving services from 1995 until its acquisition by Google in March 2008. DoubleClick offered technology products and services that were sold primarily to advertising agencies and mass media and large businesses. The company's main product line was known as DART (Dynamic Advertising, Reporting, and Targeting), which was intended to increase the purchasing efficiency of advertisers and minimize unsold inventory for publishers.
DoubleClick products were renamed and incorporated into Google’s marketing platform. These products now dominate the (non-search) internet advertising market serving both the the buyers (companies and agencies looking to buy ad slots) and the sellers of advertising (websites, publications and agents working for them). Google’s market position is shown below with their market shares in different sections of the value chain.
DSPs and SSPs are entities in the middle of the process and are defined as follows
A supply-side platform (SSP) is programmatic software for publishers to facilitate sales of their advertising impressions.
A demand-side platform (DSP) is a type of software that allows an advertiser to buy advertising with the help of automation.
It should be noted Google domination of access to both buyers and sellers of internet advertising is so strong that it could give rise to conflicts of interest. This, and Google’s general domination of this market, means that there is a likely threat of regulatory investigation and intervention.
To summarise, Google has grown strongly through its dominance of internet advertising. It has used its cashflow to make some brilliant acquisitions which have also boosted revenues in both advertising and in unrelated areas.
Google has been much less successful where it has used its cashflows to incubate new businesses. These businesses are primarily in Google Cloud Platform (GCP) and Other Bets.
Google Cloud Platform (GCP), offers cloud computing services that runs on the same infrastructure that Google uses internally for its end-user products, such as Google Search, Gmail, Google Drive etc.
GCP provides clients a set of management tools and a series of modular cloud services including computing, data storage and analytics and A.I. machine learning. In recent year Google has invested heavily in GCP in an bold attempt to catch up with the market leaders in Cloud Services which are Amazon AWS and Microsoft Azure. Revenues in GCP have grown strongly (from a low base) but it has not been profitable so far.
Other Bets is a combination of multiple operating segments that are not individually material. These include businesses such as Nest, Waymo, Verily Access, Calico, CapitalG, GV, and X. Nest develops devices for the connected home, Waymo is into developing autonomous driving systems and Verily is a life sciences business. These are cutting-edge moonshot businesses which have used up a lot of capital for research and development but have not achieved any commercial success yet. Collectively Other Bets only accounted for about 1bn of revenues in 2022 (out of US$ 282 bn) and have never been profitable.
Some investors have long argued that the huge cash generation of the core business has made Google lazy and complacent. Too much money has been poured into Other Bets; hiring and costs (including compensation) have ballooned and operational efficiency has suffered. As growth in the core business has slowed these complaints have grown more vociferous.
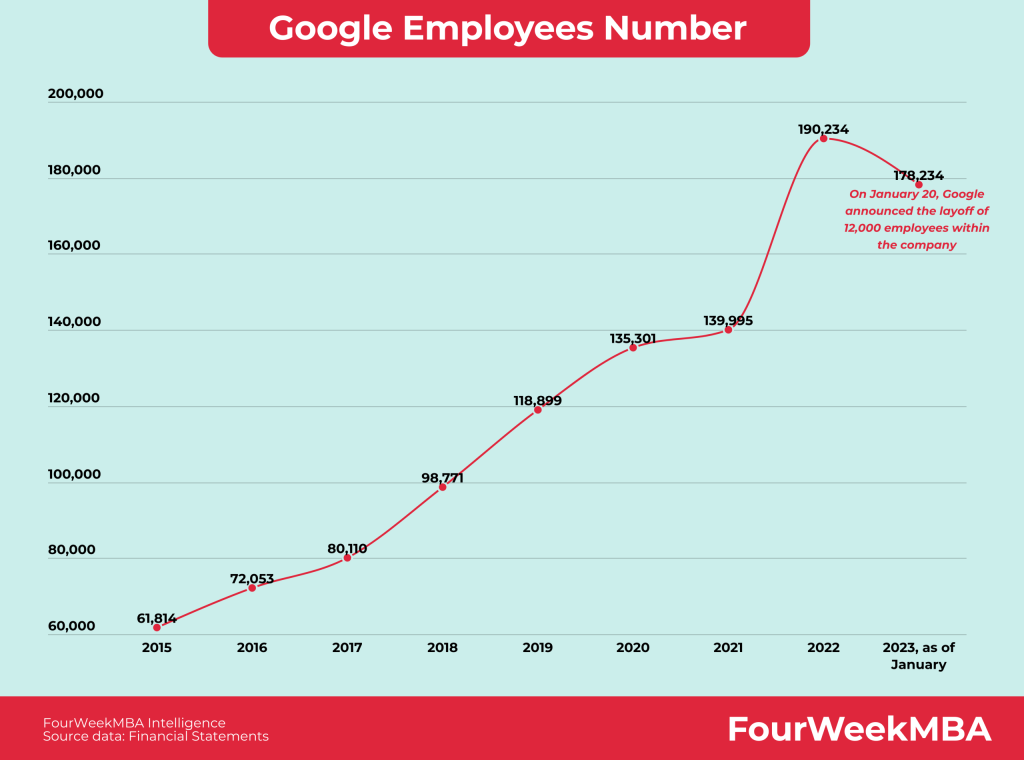
Employee numbers grew from 140,000 to 190,000 in the twelve months to September 2022. management announced 12,000 layoffs in January and more are likely to follow.
The three charts above show that operating expenses have been growing at about 25% for many years though they dipped in 2020 during the Covid downturn. Google is being urged by some investors to rein in expenses in as revenue growth is slowing to around 10% or less.
Alphabet Costs & Expenses by Quarter (Since Q4 2019)
As the chart above shows, expenses have been rising steadily up to Q4 2022.
The diagram above shows the breakdown of the Q4 2022 numbers for Google.
Total quarterly ad revenues were some US$59bn. Of this Search advertising was US$42bn while the balance was equally split into YouTube advertising and Google Admob. The latter comprises all the non-search internet advertising business described above.
Non advertising revenues were 17bn in Q4 2022 and almost equally split between Google Cloud and Google Play.
The cost of revenues of US$ 35bn in the quarter include US$ 12.9bn for TAC (Traffic Acquisition costs). TAC may need further explanation.
Apple, for example, installs Google as the default search engine on its Phones. Apple gets a credit every time an Apple phone user uses Google Search on his or her phone to do a search and clicks on advertisement which is part of the Goggle Search Output. Apple receives an annual TAC payment of US$ 20bn from Google to reflect this. Recent reports suggested that Samsung was thinking about replacing Google with Bing as the default Search engine app. Google share price fell on the news report but I am not sure it has much impact as the most searched item on Bing is Google!
Google’s latest quarterly results
Google recently reported numbers for the three months to 31 March 2023.
Quarterly Revenue came at US$ 69.7bn, a growth of just 2.6% compared with the same quarter in the previous year; expenses rose much faster than this (9.3%) and so EBIT and Net Profit fell by 13.3% and 8.4% respectively. Net income margin fell to 21%. This underlines the urgent need to cut costs.
If we look at the breakdown, the key advertising revenue at US$ 54.5bn was flat as the economic slowdown and the high absolute base begin to have an impact.
The only bright spot was the Cloud business which grew 28.1% to 7.4bn (11% of total revenue). this was similar to the growth rate achieved by Microsoft Azure and much higher tan AWS.
Other Comments in Post-earnings conference call
The CEO, Sunder Pichai used his observations to focus on three or four things. These were AI, Operational Efficiency , Cloud business and Developments in YouTube.
AI
AI has been the focus of all other large tech companies this quarter. Pichai emphasised how alphabet have been using AI for at least a decade to improve their business and noted some of the AI products they have introduced in the last few months such as Bard and Palm.
Operational Efficiency
Alphabet’s efficiency actions go beyond headcount reductions. As Pichai noted on the call
“We have significant multi-year efforts underway to create savings, such as improving machine utilization and finding more scalable and efficient ways to train and serve machine learning models. We are making our data centers more efficient, redistributing workloads and equipment where servers aren’t being fully used… Improving external procurement is another area where data suggests significant savings, and this work is underway. And we are taking concrete steps to manage our real estate portfolio to ensure it meets our current and future needs. We’ll continue to use data to determine additional areas for durable savings.”
Cloud Business
Cloud Revenues have continued to grow steadily (as shown in the chart above) and turned profitable at the EBIT level in Q1 2023.
Pichai noted that 60% of the Top 1000 companies work with GCP.
GCP is offering its AI tools to GCP clients.
YouTube
They noted the success of the monetisation short videos films called Shorts. These are analogous to Meta’s Reels and both are a response to the success of Tiktok videos
There has been an increase in the subscriptions for tube.
There has been an increase in people watching YouTube through internet-connected TV and this makes possible targeted advertising which appeals to advertisers.
Concluding Remarks
Alphabet/Google has been a very successful business over the last two and a half decades.
It has used it core search technology and acquisitions to build one the worlds largest businesses with annual revenues in excess of US$ 280bn, mostly composed of advertising revenue. The high absolute number and the downturn in the economy is making revenue growth difficult to achieve.
The Cloud business, GCP, has made pleasing progress and has become a strong third in the Cloud Hosting business behind Amazon and Microsoft.
Google has fallen behind Microsoft in AI business and will have to work hard in playing catch up. In this very fast moving sector, both companies also face a significant threat from open-source AI platforms where software engineers all over the world work collaboratively (as volunteers) on open-source platforms to develop AI Tools which they share freely.
Advertising revenue growth is slowing significantly at Google. In part, this reflects cyclical factors as the economy slows down. However, it also partly reflects the size and scale of Google’s advertising which means faster growth from this level is much more difficult.
In either case, it shows the urgency of significant cost cutting. This requires a fundamental change in the mindset and culture of the company and is unlikely to be achieved quickly or easily. It may need a much tougher manager than the current CEO
This is our biggest issue with respect to Alphabet/ Google. Revenue growth will slow and costs may not be controlled and this will lead to sustained fall in profits and free cash flow.
The current analysts’ consensus is for 17% in the next two years. I think there is a risk that this many not be achieved and the share price could come under further downward pressure.


