Ansys Inc.
Provider of tools for Industrial Designers
Ansys: Provider of tools for Industrial Designers
This company looks quite good and has attracted a lot of good write-ups. I learnt a lot from the write up on the company done by the excellent analyst who writes as MBI Deep Dives but have come to somewhat different conclusions to him.
Summary numbers look good, and it is a perfectly good growth company which dominates its niche. However, the more I investigated it, the more I doubted that as an investment, it will be a huge home run. It seems to lack operating leverage and the ability to generate serious free cash flow for investors.
However, I believe the analysis is nevertheless interesting in terms of learning about how to think about business and investments.
ANSYS (ANSS)
Key facts
Founded In 1970, with 5,600 employees as of December 31, 2022.
Headquartered in Canonsburg, Pennsylvania with 75 offices in New Hampshire, California, North Carolina, and India etc.
Ansys’s customers are large global companies like Caterpillar, Boeing, UPS, Airbus, Roll Royce GE. ABB, BP etc
Since its IPO in 1996, Ansys’ market cap has become a staggering 565x of its IPO market cap.
From a total revenue of US$47mn with 200 employees, Ansys had grown to become a company with total revenue of US$1.5bn and more than 5,500 employees.
ANSYS, Inc. develops, markets, and supports software solutions for design analysis and optimization.
The Company's software
accelerates product time to market,
reduces production costs,
improves engineering processes, and
optimizes product quality and safety for a variety of manufactured products.
ANSYS product family features open, flexible architecture for easy integration into the customers’ design and production processes.
Overview
I am a non-technical layperson . Let me, perhaps foolishly, venture into the unknown and talk about the work of designers and engineers in manufacturing industry. They are highly trained people who must create new products which serve some need, and which must be produced at reasonable cost. Given today’s competitive pressures, they must often work at unreasonable speed. Ansys’s software lets designers see how their ideas play out even before a prototype is built, by simulating designs on a computer. The software analyses models for their response to combinations of physical variables as stress, pressure, impact, temperature, and velocity. Simulation tools codify physical laws into software so that engineers can see how a product fares under real world stresses, often several simultaneous physical processes (“multi-physics”).
ANSYS makes money by licensing its software to customers and by maintaining and servicing those accounts. Licenses account for 40% of their revenues while maintenance and services account for 60%.
The products include ANSYS Workbench, a framework that ties together the entire simulation process, guiding the user through multiple types of analysis. Other products are geared toward specific uses and industries. They include Structures, Fluids, Electronics, Semiconductors, Embedded Software, Systems, High-Performance Computing, and 3-D Design.
Products are used by engineers, designers, researchers, and students across a range of industries and in academia. Their customers are in the aerospace and defence, automotive, industrial equipment, electronics, biomedical, energy, materials and chemical processing, and semiconductor sectors. The Company focuses on open and flexible solutions that enable users to analyse designs directly on the desktop, providing a common platform for product development, from design concept to final stage testing and validation.
Ansys has 40,000 customers ranging from small consulting firms to multinational enterprises. The largest customers include Caterpillar, Rolls-Royce, Boeing, Lenovo, UPS, Lockheed Martin, Airbus, Nestle, GE, ABB, Huawei, Autodesk, Baker Hughes, Qualcomm, Ford, TechnipFMC, Medtronic, and Speedo.
The US accounts for about 40% revenue and Japan and Germany account for about 10% of revenue each. European countries other than Germany supply about 15% of revenue.
ANSYS sells its products directly and through channel partners worldwide. Indirect sales account for about 25% of ANSYS' revenue. In addition, it collaborates with Computer-Aided Design (CAD) and electronic design automation (EDA) system providers such as Autodesk and Cadence Design Systems to provide links between the latter’s design packages and ANSYS' simulation portfolio. These strategic alliances provide additional marketing opportunities for the company.
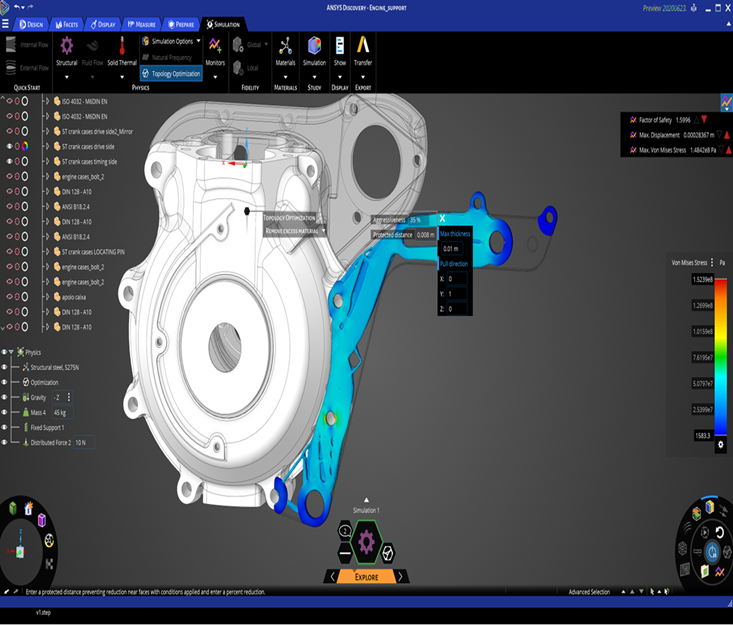
Two Screenshots of desktops of Ansys Software.
Distribution Strategy.
As the company has 40,000 customers and a long tail of small ones, Ansys has developed a segmented distribution strategy.
In terms of resources, there are about 250 channel partners and 2,100 employees in domestic and international strategic sales offices.
The customers are segmented in the following way:
· Volume (~1000s of accounts) largely serviced by channel partners.
· Strategic (~100s of accounts), and
· Enterprise (80+ accounts). Enterprise are the largest customers.
Segmenting the customers in this manner has been a driving force for Ansys’ recent growth ramp up. Five years ago, Ansys did not have separate sales team for Enterprise accounts. In 2016, it had 15 enterprise customers, and this has increased to 80+ by 2019.
The company sees opportunities for continued growth in key industries.
In automotive, investments in autonomous vehicles and electric vehicles should drive demand for ANSYS' products. The development of smart, connected products and 5G networks as well as increased defence spending in the US and Europe will all support Ansys growth.
No single simulation vendor will always have the entire product range to anticipate the ever-expanding needs of their clients, so acquisitions will always be part of the story. The acquisitions are usually small and are driven by the need to get some niche capability. Therefore, they should be seen as a recurring R&D expense, required to remain technically on par with acquisitive competitors.
Acquisition Strategy
The company made several acquisitions in 2018/ 019 that expanded its capabilities across its portfolio. ANSYS's strategy is to make acquisitions to extend product lines and fill product gaps. They have made a series of acquisitions in the last five years. The strategy is to enhance its simulation portfolio solution to meet its objective of pervasive engineering simulation. The acquisitions are relatively small but are not accretive to margins. They do sometimes have some slight positive impact to cash flow, but there are meaningful year-one expenses associated with integration etc.
The table below give some detail on recent acquisitions.
We have looked at online videos and descriptions of the products of these acquired companies. As far as we can judge, they all appear to be in the course area of advanced simulation and related software. What is more difficult to ascertain is whether Ansys is overpaying for these acquisitions.
What is the value proposition of simulation software?
Simulation has historically been used in the design and analysis phase of the product life cycle. The value to engineers is clear: rapid innovation, lower cycle time, managed complexity, and increased quality. The business can drive more products to market, make sure these are the right products and do so faster. This can translate into faster top line revenue growth.
Simulation makes R&D more effective and more efficient. You can reduce or even eliminate the need for physical prototypes and save costs. And better quality means lower warranty costs. It all adds up to a quantifiable, tangible, demonstrable ROI. The impact shows up in top line revenue growth and in bottom line cost saving.
The customers pay for Ansys’s products from their R&D budget. In good times, companies spend more on R&D. In bad times, R&D is often the last area to get cut in a resilient company. Air travel was hit hard in 2020 due to Covid but Ansys did not experience a drop in demand for products and services from aerospace manufacturing customers. R&D projects are typically multi-year initiatives and are usually not scrapped due to any temporary financial setbacks. Ansys believes they are a recession resilient company and argue that the cost savings derived from simulation becomes even more important during business downturns.
Ansys note that although only 3-4% of the R&D budget is spent when the basic product is designed and conceived, up to 80% of total lifecycle cost gets locked-in this stage. Finding and eliminating defects at this early stage can save a lot of money later. It is far cheaper to iterate designs via simulation software than building physical prototypes or fix the defects later.
Ansys believes its simulation products should be prevalent in all industries and it essentially wants to be a “picks and shovels” play in the global manufacturing space. Many companies will compete in the race to create new technological products but almost all players will have to invest in the sort of products that Ansys sells.
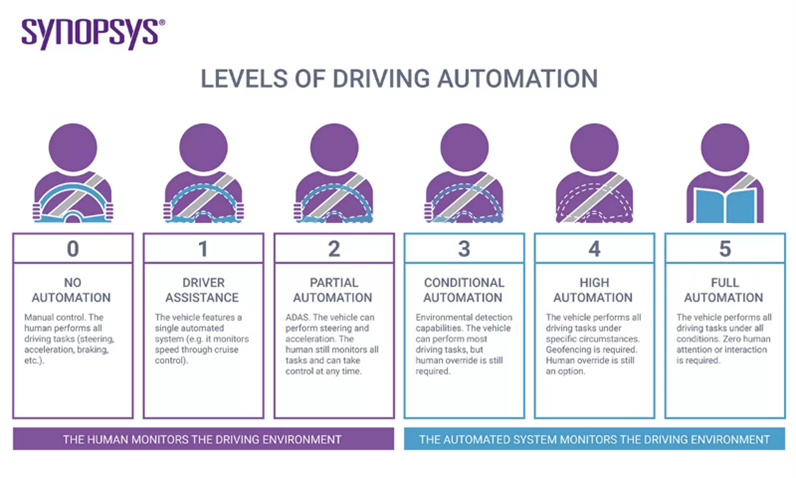
Ansys uses Autonomous Vehicles (AV) as an illustration. AVs require 8.8 billion miles of testing to reach the desired reliability level. That is almost 200 years of driving which is obviously out of the question. The only way level 5 AVs (see diagram below) can reach the required level of reality is via simulation testing.
What is the total Addressable Market (TAM)
As a rule, one should be sceptical of estimates of TAM produced by companies since they have every incentive to overstate it. Bearing this in mind, we note that Ansys estimated its TAM at US$6.6bn which compares with their current top line of US$ 1.6bn.
We can apply a ballpark reasonableness test on this. The Global R&D market is large but a significant part of it is in China where Ansys has little presence. Excluding China, R&D dollars are expected to amount to about US$ 1.5 trillion. If 70-80% are spent on physical prototyping, this is a potential end market of ~$300-450bn for other R&D. Ansys estimated TAM for simulation software of US$6.6bn appears to be a conservative to 2% of the total prototyping budget. As far as we can judge, the TAM estimate appears to be realistic.
Ansys has outlined what they believe to be three biggest barriers for wider adoption of simulation software.
a) you need a PhD to be a simulation analyst.
b) simulation software is assumed to be mostly relevant for large companies; and
c) adoption inhibited by legacy processes
Ansys has focused on these issues in recent years.
a) Simulation Analysts need to have a PhD.
The systems-level simulations enabled by Ansys’s tools are generally reserved for advanced PhD-level engineers (among the flavours of software used in design and manufacturing, simulation is considered the most challenging). Clearly any software which needs an Engineering PhD to run it will limit the demand for it. There are 10 times as many design engineers as there are simulation analysts. The former can be hired with undergraduate degrees and trained up to become simulation analysts. Ansys believes that there are up to 8 million engineers who could take simulation software training. There are currently 3,200+ engineering schools globally which teach a course on simulation at undergraduate level. Ansys offer a free version of their software to students. Carnegie Mellon University and Cornell University teach a massive online course using ANSYS technology, and over 100,000 people have signed up. There have been 1 million downloads of the ANSYS Student edition software.
In February 2018, Ansys launched a product called Discovery Live in an attempt to “democratize simulation” by simplifying simulation and analysis tools for design engineers. Currently, 40% of Ansys’s Enterprise customers have an initial license of Discovery Live in their contracts. Discovery Live automates more steps, reduces pre-processing, and simplifies the user experience with drag and drop interfaces.
ANSYS report that one of the most common reasons, simulation analysts want their employers to adopt Discovery Live is because it can answer questions that they are usually called upon to answer. Design engineers typically email or call simulation analysts when contemplating a design change. With Discovery Live, the simulation analyst is no longer interrupted with these questions.
b) simulation software is assumed to be mostly relevant for large companies. Ansys is well lodged with large companies. It currently serves:
· 22 of top 25 automotive suppliers,
· 23 of top 25 aerospace & defence OEMs,
· 7 of top 10 oil & gas companies,
· 10 of top 10 industrial equipment companies, and
· 10 of top 10 leading chip design companies.
There’s a strong, intuitive case for wider adoption of simulation in industries that may not extensively use it currently. Ansys identified 4 key areas as “Emerging High-Growth” segments for the next decade where new smaller but faster growing customers may come from. These areas are electrification (including battery technology), Autonomous Vehicles (AV), 5G, and Industrial Internet of Things (IOT). The CAGR of this “Emerging High-Growth” segment is expected to be 21% for next 5-7 years. Ansys has more than 750 startups under its program who utilize Ansys Cloud (Azure is a major partner for Ansys cloud services).
c) Legacy processes
Ansys believes there are a lot of legacy process that still must change before design engineers adopt simulation. For manufacturing, 3D printers are so expensive, and customers are still waiting for the price to come down to an affordable level. It is likely that there will be some time before the problems caused by legacy processes can be overcome.
Management
Dr. Ajei Gopal - President and Chief Executive Officer
Dr. Gopal has served as Ansys President and Chief Executive Officer since 2017. He was appointed an independent director of the Board in 2011 and served in that capacity until his employment by the Company in 2016. From 2013 to 2016, Dr. Gopal was an operating partner at Silver Lake, a leading private equity technology investor. His employment at Silver Lake included a secondment as interim President and Chief Operating Officer at Symantec in 2016. He has worked for various Us technology firms since 1991 including IBM and Computer Associates. He has a degree in Mechanical Engineering from the Indian Institute of Technology, Mumbai, and a PhD. in Computer Science from Cornell University.
Dr. Prith Banerjee - Chief Technology Officer
Dr. Prith Banerjee is the Chief Technology Officer of Ansys. He is responsible for leading the evolution of Ansys’ Technology strategy. Previously, he has worked at Korn Ferry, Schneider Electric, Accenture, ABB, and HP. Formerly, he was Dean of the College of Engineering at the University of Illinois at Chicago. In 2000, he founded AccelChip, a developer of products for electronic design automation, which was acquired by Xilinx Inc. in 2006. He has a degree in Electronic Engineering from the Indian Institute of Technology, Kharagpur, and an M.S. and Ph.D. in Electrical Engineering from the University of Illinois, Urbana-Champaign.
Competition
There are a number of competitors such as Autodesk Inc (in some segments; they collaborate in others) PTC Inc., Cadence Design Systems, Inc., Synopsys, Inc., Altair Engineering Inc., Aspen Technology, Inc., Dassault Systemes and Siemens. Dassault and Siemens as primary competitors in multiple segments whereas Cadence and Synopsys appear as competitors in fewer segments. However, most of these companies do not have simulation as their key focus.
It is interesting that most of the companies were founded more than 35 years ago. ANSYS and Abaqus (Dassault) for example started in the 1970s. This is surprising given the high margins and the secular growth in this industry. There may be barriers to entry in this segment which is in contrast with many technology sub-sectors. Developing engineering simulation software is a time-intensive process. As the essential physics does not change, information input years ago retains value and software becomes more powerful with each incremental addition of information. New entrants to the industry would lack the years of regression testing and validation needed to build a strong track record. The decades spent developing the software is the source of a moat. As simulation is used for critical business functions, companies will favour known existing suppliers compared with newer companies. The Licenses offered by Ansys are expensive but there is a high switching cost as people need to learn new systems. Ansys integrates all its products/software in its platform seamlessly which allow engineers work with the Multiphysics solutions within the platform.
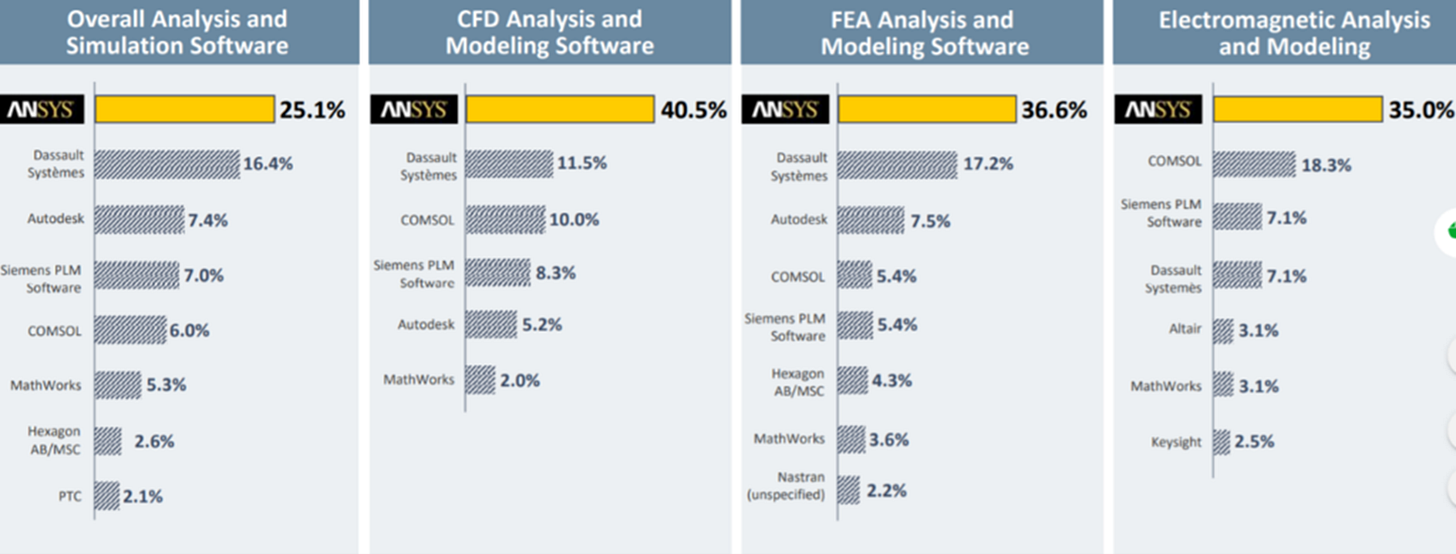
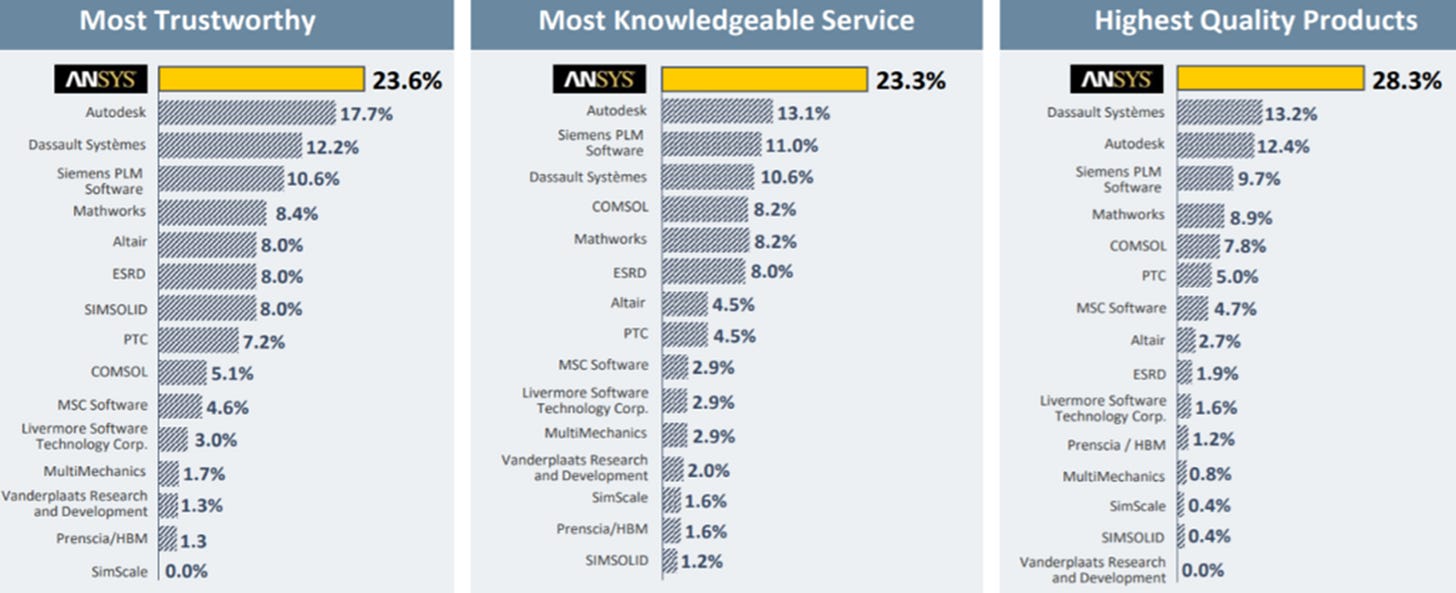
A survey by the website, Digital Engineer showed that Ansys – which is the largest simulation player in the space with 25% market share-is well positioned the most critical simulation categories.
While other companies focus on specific areas, e.g. – Autodesk is big in architecture, engineering, and construction (AEC) or PTC focuses on manufacturing; simulation players like Ansys cover a very broad range of industries in a more generic way.
Ansys occupies a clear leadership role in the most technically challenging part of the value chain. The suite of solutions it has integrated over 50 years of R&D and acquisitions would be nearly impossible to replicate. Ansys may be the most competitively advantaged company in the whole CAD/simulation space and enjoys significant secular tailwinds to support 10%-12% organic growth for the foreseeable future.
US$ Millions unless noted otherwise Source: Stratosphere.IO
In recent years, revenues have grown high single digit (hsd) to low double-digit (ldd) percentages in the last few years. This is not the typical high- growth (20% to 40%) that many technology companies exhibit. Revenues have increased 2.5 times between 2013 and 2022, from US$ 860mn to 2.1bn. The net profit (shown as brown bars in chart) has also grown about 2.5 times between 2013 and 2022.
The Gross Margin is very high in the 86%-88%. This is like Adobe. It reflects the fact that the cost of goods sold for software developed a long time ago is quite low. Our estimates suggest that both sales and net profit have grown at about 13% (CAGR) in the last five years which suggests there is not much operating leverage in the business. R&D and SGA expenses have grown line with Revenue. In fact, operating margin fallen from 37% in 2013-15 to 27%-29% in 2022. Net income margin is 25%. The total number of shares has been steady at about 86-87mn in the last five years.
The chart below shows Gross Margins are around 88% while operating margin is much lower at around 29% .
The charts above shows the company’s Free cash flow from has moved in line with cashflow from operations. The small difference between them illustrates the low capex requirements.
The company’s business model has a strong tendency to convert net sales to free cash flow. For example, in December 2022, net income of US$ 524mn translated into free cashflow of USD 606mn.
The company generates consistently generates high and rising operating cash flow from operations and the money is mostly used to acquire new companies and repurchase stock.
Acquisitions have consumed nearly half of Ansys’ free cash flow over the last decade. The company seem to need to do small acquisitions to address new industry verticals and acquire industry-specific R&D. In this case, a significant portion of the amount used for acquisitions should be classified as (R&D) Capital Expenditure. If such expenditure is always needed, the company may never generate significant free cash flow for investors.
The stock repurchases are used mainly to offset dilution. The total number of shares has been steady at about 86-87mn in the last five years despite the significant stock purchases that have occurred in the last 5-10 years. This is another negative in our view, ideally share purchases should lead to a proportionate decrease in the value of shares. This probably reflects the fact that stock-based compensation is too high.
Source:Stratopspshere.IO
The table above shows the growth in total assets and in goodwill between 2015 and 2022 . Total asset have grown about 2.5 times from US$ 2.7bn to US$ 6.7bn( about 2.5 times and in tandem with both revenues and profits ). Over the same period, goodwill has grown 3 times from 1.5bn to 4.5bn due to the kind of takeover activity noted above.
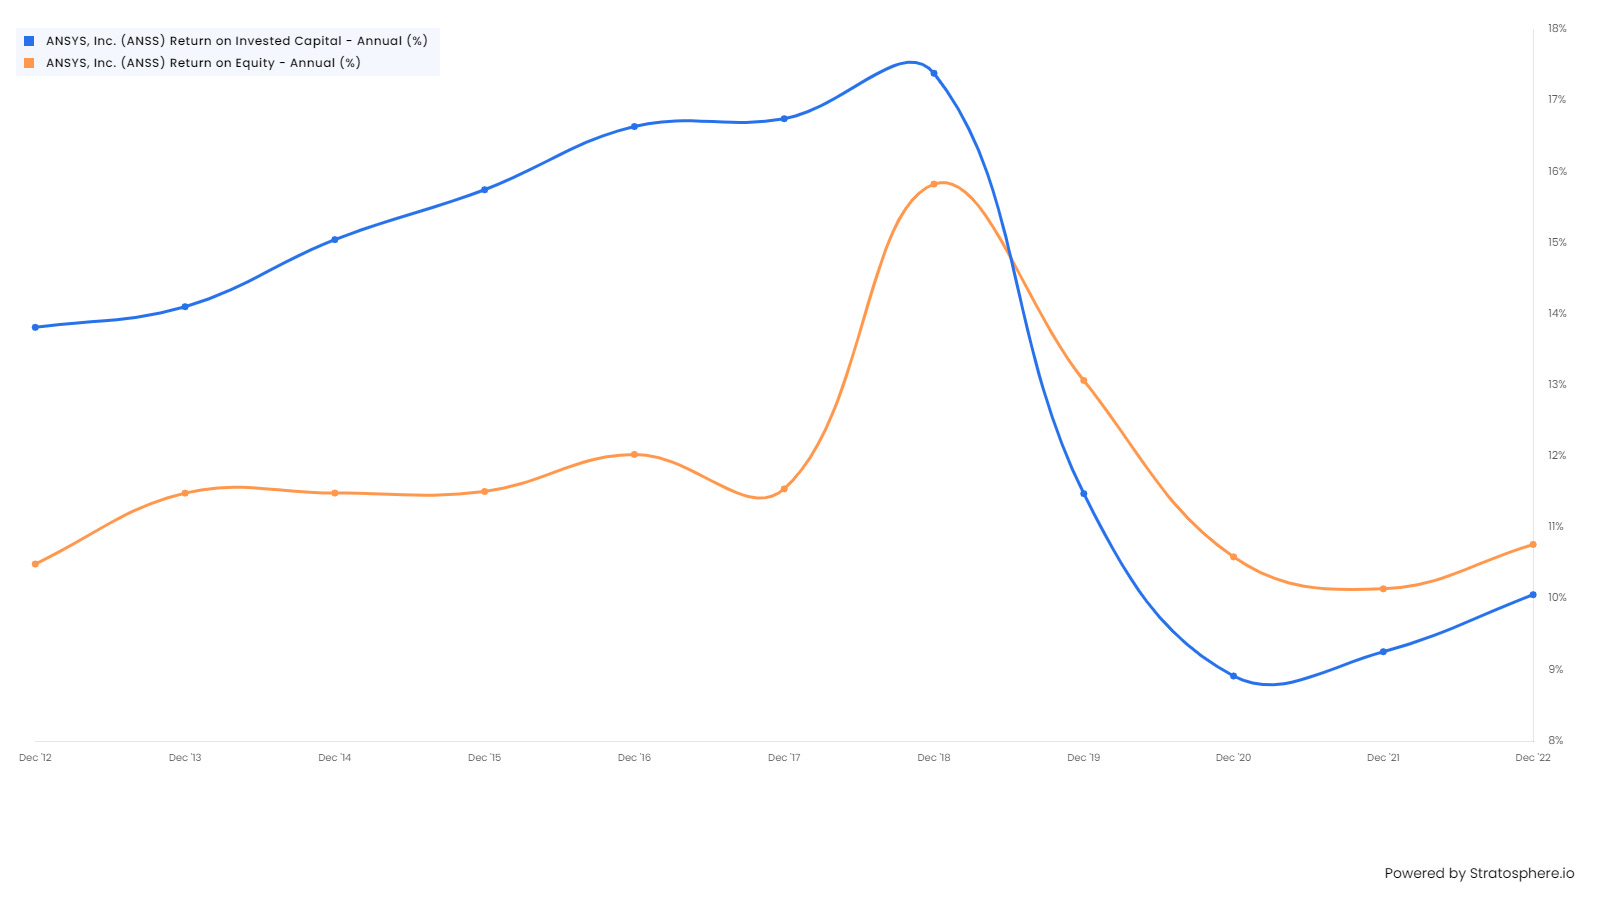
The chart above shows the profitability of the company (as measured by ROE/ ROIC) is in the range of 10% to 11%. This is lower than many other tech companies and reflects the fact the denominator has been boosted by the high level of goodwill arising from takeovers noted above. If, at some point in the future, the value of acquisitions slows down meaningfully, ROE/ ROIC would gradually rise. Given current economics, the ROE could rise from the current 10% to about 18%. As already noted, margins (especially at the gross level) are high. The company does not use excessive leverage (Interest cover is 26 times and Long-term debt to capitalisation is 0.1%).
Management KPI
One of the key numbers that the management of the company looks at is Annual Contract Value (ACV). Over the life of the contract, ACV equals the total value realized from a customer. ACV is not impacted by the timing of license revenue recognition unlike reported revenues. ACV is in financial and operational decision-making and in setting sales targets used for compensation.
ACV is composed of the following:
• the annualized value of maintenance and subscription lease contracts with start dates or anniversary dates during the period, plus
• the value of perpetual license contracts with start dates during the period, plus
• the annualized value of fixed-term services contracts with start dates or anniversary dates during the period,
plus
• the value of work performed during the period on fixed-deliverable services contracts.
The anniversary dates is the date of the beginning of the next twelve-month period in a contractually committed multi-year contract.
If a contract is three years in duration, with a start date of July 1, 2022, the anniversary dates would be July 1, 2023 and July 1, 2024.
Example 1: For purposes of calculating ACV, a $100,000 subscription lease contract or a $100,000 maintenance contract with a term of July 1, 2022 – June 30, 2023, would each contribute $100,000 to ACV for fiscal year 2022 with no contribution to ACV for fiscal year 2023. The company has a December year-end.
Example 2: For purposes of calculating ACV, a $300,000 subscription lease contract or a $300,000 maintenance contract with a term of July 1, 2022 – June 30, 2025, would each contribute $100,000 to ACV in each of fiscal years 2022, 2023 and 2024. There would be no contribution to ACV for fiscal year 2025 (which would end on December 312025).
Example 3: A perpetual license valued at $200,000 with a contract start date of March 1, 2022 would contribute $200,000 to ACV in fiscal year 2022.
As can be seen below, on 31 December 2022, the ACV was just above US$ 2bn which, at this point is equal to the reported revenue in FY 2022.
Segments & KPI
Units: US$ Millions Source: Stratosphere.IO
We have implemented a quick and dirty DCF valuation of the company. This requires several assumptions about various metrics including future revenue growth and Operating Cash Flow margin. There is some debate about the utility of valuation models. Many assumptions must be made, and the final result is very sensitive to the exact values chosen. It is a case of garbage in – garbage out (GIGO). Given this large health warning, we calculated a present below a basic Levered DCF calculation of the value of the shares of Ansys. This yields an estimated fair value of US$ 280 per share compared with the current price of US$ 312.
Conclusions
Ansys is an impressive technology company which over fifty years has developed or acquired significant IP in the field of simulation. Ansys has several competitors, but none are as fully focused on simulation software. Ansys is the leader in most categories. The company is consistently profitable and free cashflow positive and has a long track record of consistent revenue and earnings growth.
However, there a few concerns which have become apparent during this analysis, and which makes me cautious.
The simulation software market maybe too small. After 50 years and numerous acquisitions, the company’s top line is only 2bn.
The sector perhaps cannot grow much above the 12%-14% revenue growth that we have seen in the last decade. This is much less than companies in the other technology segments.
The business does not seem to have any significant economies of scale/ operating leverage as EPS /net profit growth has been completely in line with revenue growth and never really exceeded it.
The business does not seem to be very profitable. The ROE has been between 11% to 13% over the last decade and has not grown. This is much less than other technology companies. The numerator growth in the numerator (net profits) is offset by the growth in the denominator (due mainly to the growth in goodwill arising from acquisitions).
On paper, the situation with respect to free cash flow look positive. Capital expenditure is relatively low and therefore most of the operating cashflow is converted to free cashflow. However, the company spends a significant percentage of its operating cashflow on acquisitions. These acquisitions are mostly to acquire R&D and therefore could reasonably be reclassified as capital expenditure. If this adjustment is made, the effective free cashflow generated by the company is much less than is suggested in the cashflow statement.
The other main use of operating cashflow is share repurchases. In fact, over the last ten years, almost all the operating cashflow has been used for acquisitions or share repurchases. Despite, the share repurchases in the last five years, the number of shares outstanding has not declined. This may be due to the issuance of new shares for part financing of acquisitions with equity or as part of stock-based compensation to employees.
In summary, the free cashflow generated is likely to be quite low and the benefit of it disproportionately accrues to the selling shareholders of companies being acquired by Ansys or the employees of Ansys rather than its shareholders.
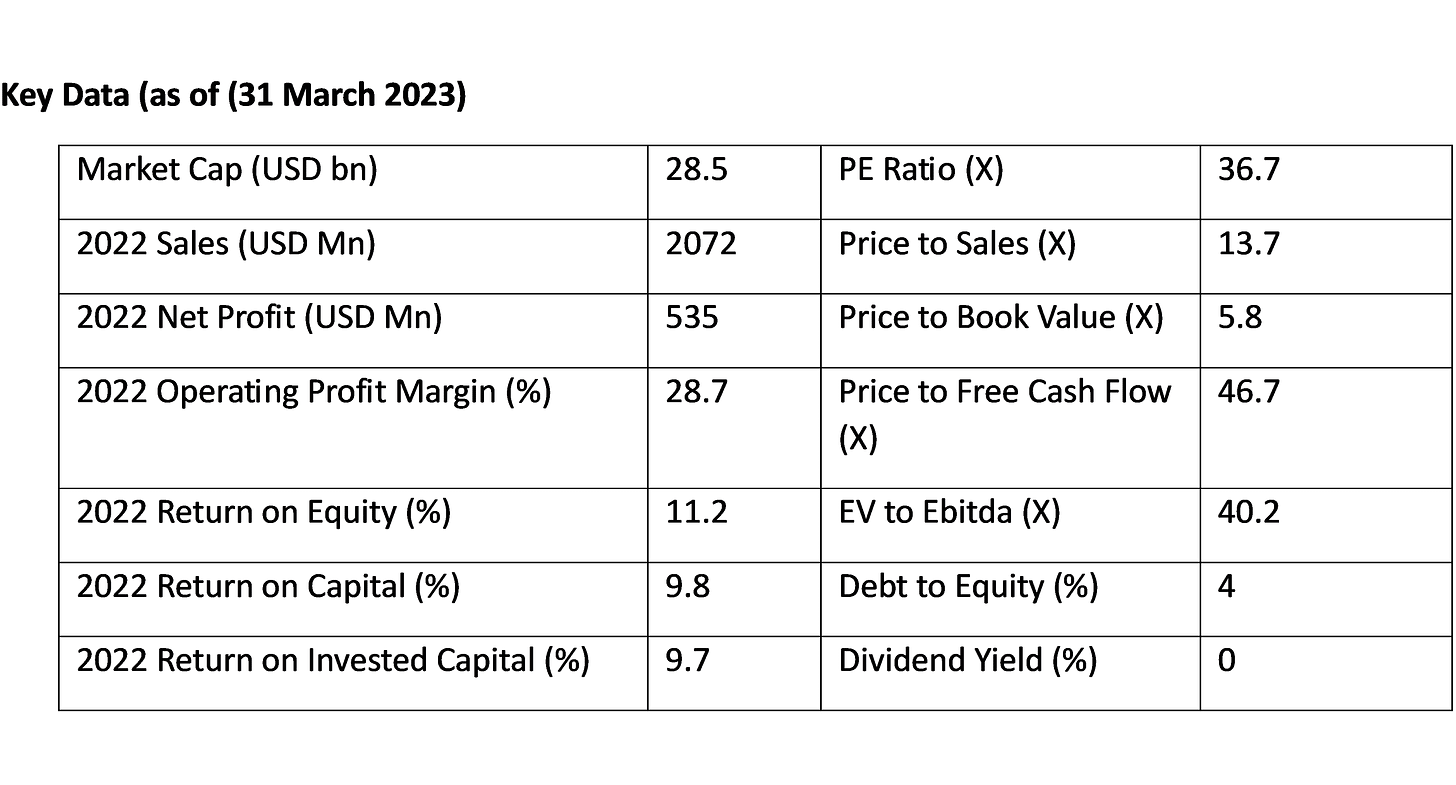
The DCF valuation that we ran suggested a fair value of the shares could be around US$ 280 per share. We would look to buy the share at (say a 20%) discount to the fair value which suggests a share price of about US$ 220 per share. The share price of US$ 320 is at 50% our desired entry level. At a more basic level, a company with an ROE of 11% to 13% trading at a P/E ratio of 36 times intuitively feels expensive even if one makes an allowance for the quality of the company. A multiple of 18 to 20 feels more reasonable and that would imply a share price of about US$ 200.
The company has generated huge wealth for shareholders since 1996. However, looking forward it will be difficult for the stock in my view to generate return much greater than 10% to 12% (CAGR) over a longer period. In fact, an investor buying at the current high multiple has a high risk of a return less than this.


