


Introduction
HEICO Corporation (HEI/A), which is a manufacturer of jet engine and aircraft component replacement parts, is another company on our watchlist.
We have not had a chance to write a detailed report on the company. We will do so when time permits. In the meantime, we present a short note here following the release of Q3 FY23 quarterly results today.
HEICO was founded in 1957 as Heinicke Instruments to make laboratory products, the company moved into jet engine parts in 1974 with the acquisition of Jet Avion. The company changed its name to HEICO (a shortened version of its previous name) in 1985.
HEICO Corporation designs, manufactures, and sells aerospace products and services through its subsidiaries. The Company's customers include airlines, defense contractors and military agencies worldwide, including the United States Air Force, the United States Navy, and the National Aeronautics & Space Administration (NASA). They key thing is these customers look for long-term, pre-qualified suppliers who can perform to stringent standards. They will not drop suppliers in favour of new unproven players just because the latter are cheaper.
The company has two reporting segments:
Flight Support Group (FSG) and Electronic Technologies Group (ETG).
FSG uses technology to design and manufacture jet engine and aircraft component replacement parts. They make FAA-approved replacement parts for jet engines that can be substituted for original parts, including airfoils, bearings, and fuel pump gears. FSG repairs, overhauls and distributes jet engine and aircraft components, avionics and instruments for domestic and foreign commercial air carriers and aircraft repair companies, as well as military and business aircraft operators.
ETG designs, manufactures and sells various types of electronic, data and microwave, and electro-optical products, including infrared simulation and test equipment, laser rangefinder receivers and electrical power supplies.
HEICO has operations and facilities in more than 10 countries across Asia, Europe, and the Americas. It markets its products and services in approximately 115 countries. The US accounts for 65% of sales.
HEICO sells its products through in-house personnel and independent manufacturers' representatives. It has a broad customer base consisting of domestic and foreign commercial and cargo airlines, repair and overhaul facilities, OEMs, domestic and foreign military units, defense industry manufacturers, and medical, telecommunications, scientific, and industrial companies.
The commercial aviation industry accounts for about 40% of sales, with the defense and space industries generating about 45%, and electronics, medical, and more than 15% of sales from industrial markets, including electronics, medical and telecommunications. Its five largest customers account for more than 20% of net sales.
Strategy
HEICO has two-pronged strategy for growth
1) Acquisitions : HEICO targets acquisitions that allow it to broaden its product offerings, services and technologies while expanding its customer base and geographic presence. It makes an acquisition almost every year. HEICO claims it has a disciplined acquisition strategy which limits itself to businesses that it believes will continue to grow, offer strong cash flow and earnings potential, and are available at fair prices. The acquisitions tended to be small -around 5 to 10% of HEICO’s market capitalisation.
2) Approvals for producing parts: Another element of its strategy is the continued design and development of an increasing number of PMA replacement parts in order to further penetrate its existing customer base and obtain new customers. A PMA is a production approval allows you to produce articles that are eligible for installation on FAA type certificated airplanes.
Adam Sessel in this book “Where the Money Is” writes about HEICO’s product runway.
“Despite this spectacular rise, HEICO today still has less than a 5% market share of aftermarket spares. After a generation in the business, HEICO now makes 10,000 generic parts, or one-half of 1% of the 2 million total parts on a plane. At its current rate of introducing seven hundred new parts annually, it would take HEICO 3,000 years to produce all those parts in generic form. Even if you took a conservative view and said that 75% of the parts were too complex to ever be genericized, it would still take HEICO seven centuries to manufacture the rest.”
The Results
Q3 Net sales increased 27% to a record $723mn, up from $570mn in the Q3 2022.
Operating income increased16% to $150mn in Q3 2023 up from $129mn in
The consolidated operating margin was 20.7% compared with 22.6% in Q3 2022.
Improvement in the commercial aerospace market has resulted in twelve consecutive quarters of sequential growth in net sales at FSG.
Net income attributable to HEICO increased 24% to $102 million, or $.74 per diluted share, in Q3 2023, up from $83mn, or $.60 per diluted share, inQ3 2022.
Net income attributable to HEICO increased 18% to a record $300mn, or $2.17 per diluted share, in the first nine months of FY 2023, up from $255mn, or $1.85 per diluted share, in the first nine months of FY 2022.
HEICO completed the acquisition of Wencor for $1.9 billion in cash and shares. The transaction is HEICO's largest ever in terms of purchase price, as well as revenues and income acquired (15% of HEICO’s Market Capitalisation). The company anticipates this deal, which they describe as a highly synergistic acquisition to be accretive to earnings within a year. This acquisition is four times larger than the previous largest one.
Cash flow from operations was $146 million in the Q3 2023, as compared to $149 million in Q3 2022. .
Flight Support Group (FSG)
FSG achieved quarterly increases of 26% and 23% in operating income and net sales, respectively, as compared with Q3 2022. Organic sales grew 19%. FSG has now achieved twelve consecutive quarters of growth in net sales.
FSG operating income increased 26% to $89.2 million up from $70.8 million in Q3 2022.
FSG operating margin improved to 22.0% up from 21.4% in Q3 2022.
Electronic Technologies Group (ETG)
ETG net sales increased 33% to a record $326 million in Q3 2023, up from $244 million in Q3 2022.
ETG operating income increased 9% to $74.2 million, up from $68.0 million in Q3 2022.
ETG operating margin was 22.8% compared with to 27.9% in Q3 2022.
On the face of it, these results look quite good compared with the historical record which is illustrated below.
Chart 1: HEICO’s Stock Price’s 33 year Performance.

Over 33 years, HEICO’s share price has achieved a CAGR increase of 20.5% and has outperformed some of our favoured stocks such as Copart Inc (18.3%) and Berkshire Hathaway (13.1%) over the same period.
Chart 2: HEICO’s Annual Revenue over last 10 years

Over the last ten years, HEICO revenues have grown from US1bn in 2013 to 2.2bn in 2022, a CAGR growth of ~10%.
Chart 3: HEICO’s Quarterly Revenue Growth

Sales have recovered from the Covid-19 hit to aviation in 2020 and in the last 8 quarters have grown at a growth rate in the range of ~ 18% -27%.
Chart 4: HEICO’s Quarterly Revenue
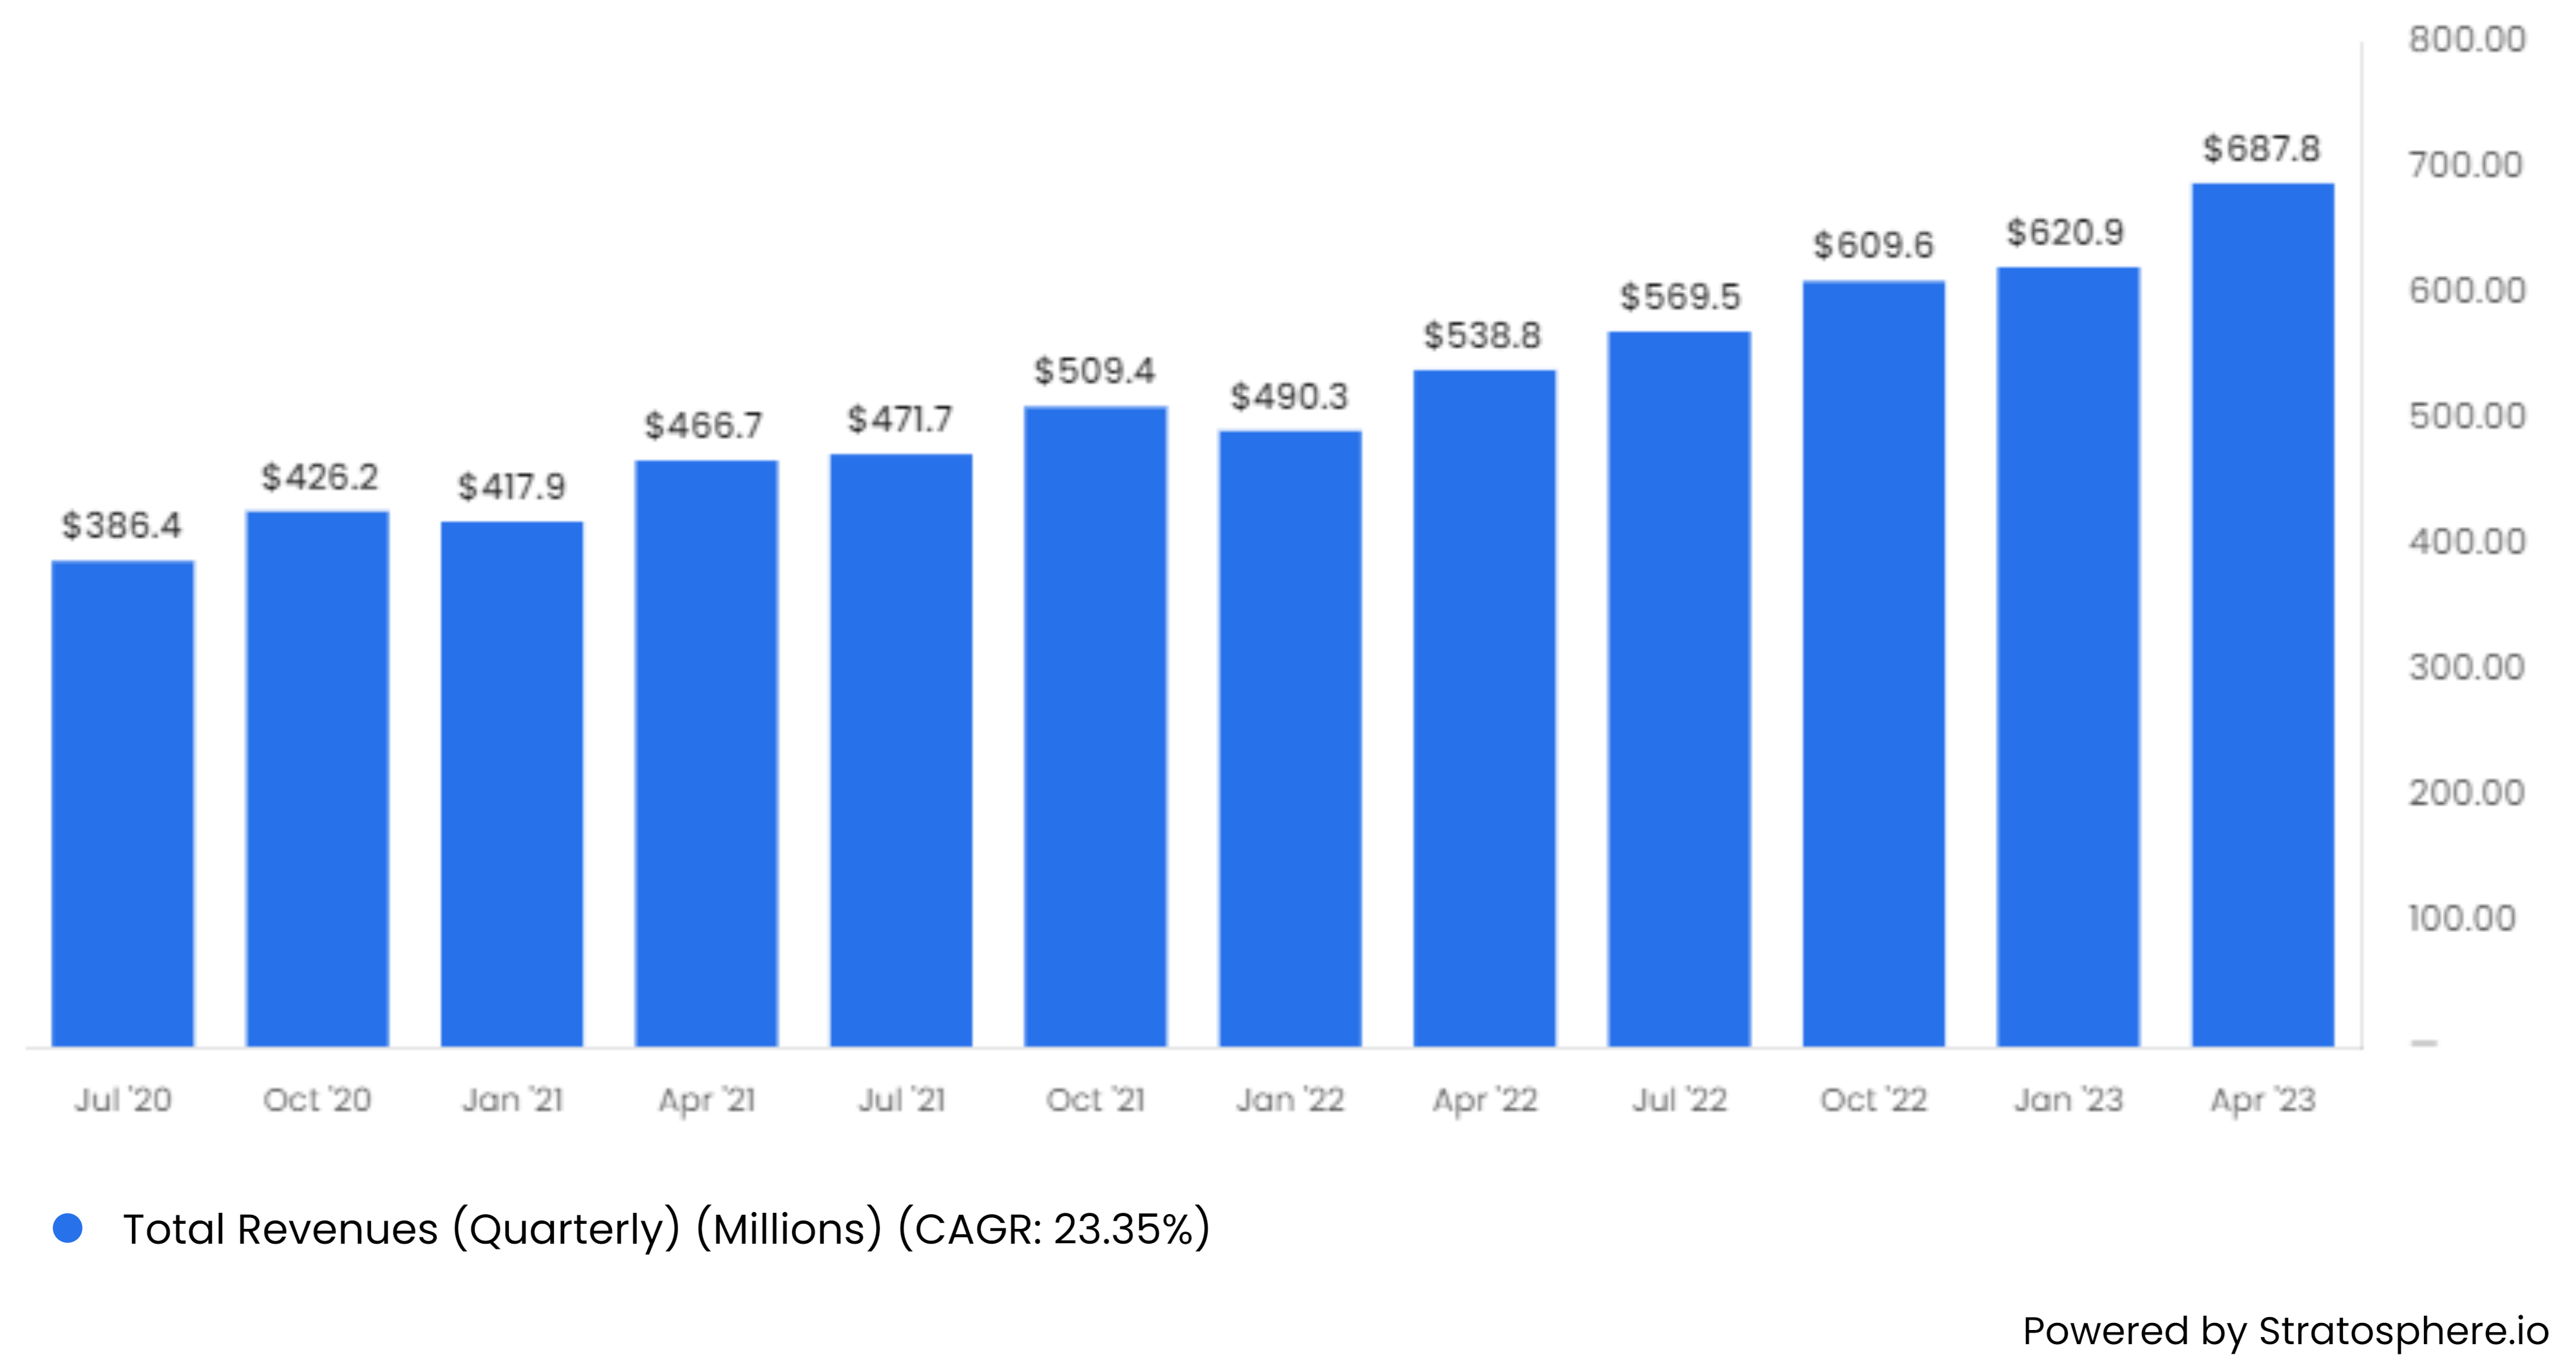
Chart 5: HEICO’s 10-year Annual Operating Income

Operating Income in the last ten years has grown at a rate of 12.6% CAGR.
Chart 6: HEICO’s Gross, Operating and Net Margins

Margins have been stable to rising in the last ten years. Gross Margins are at ~39%, Operating Margins at ~20%-22% and Net margins at ~15%.
Chart 7: HEICO’s Net Profit and EPS

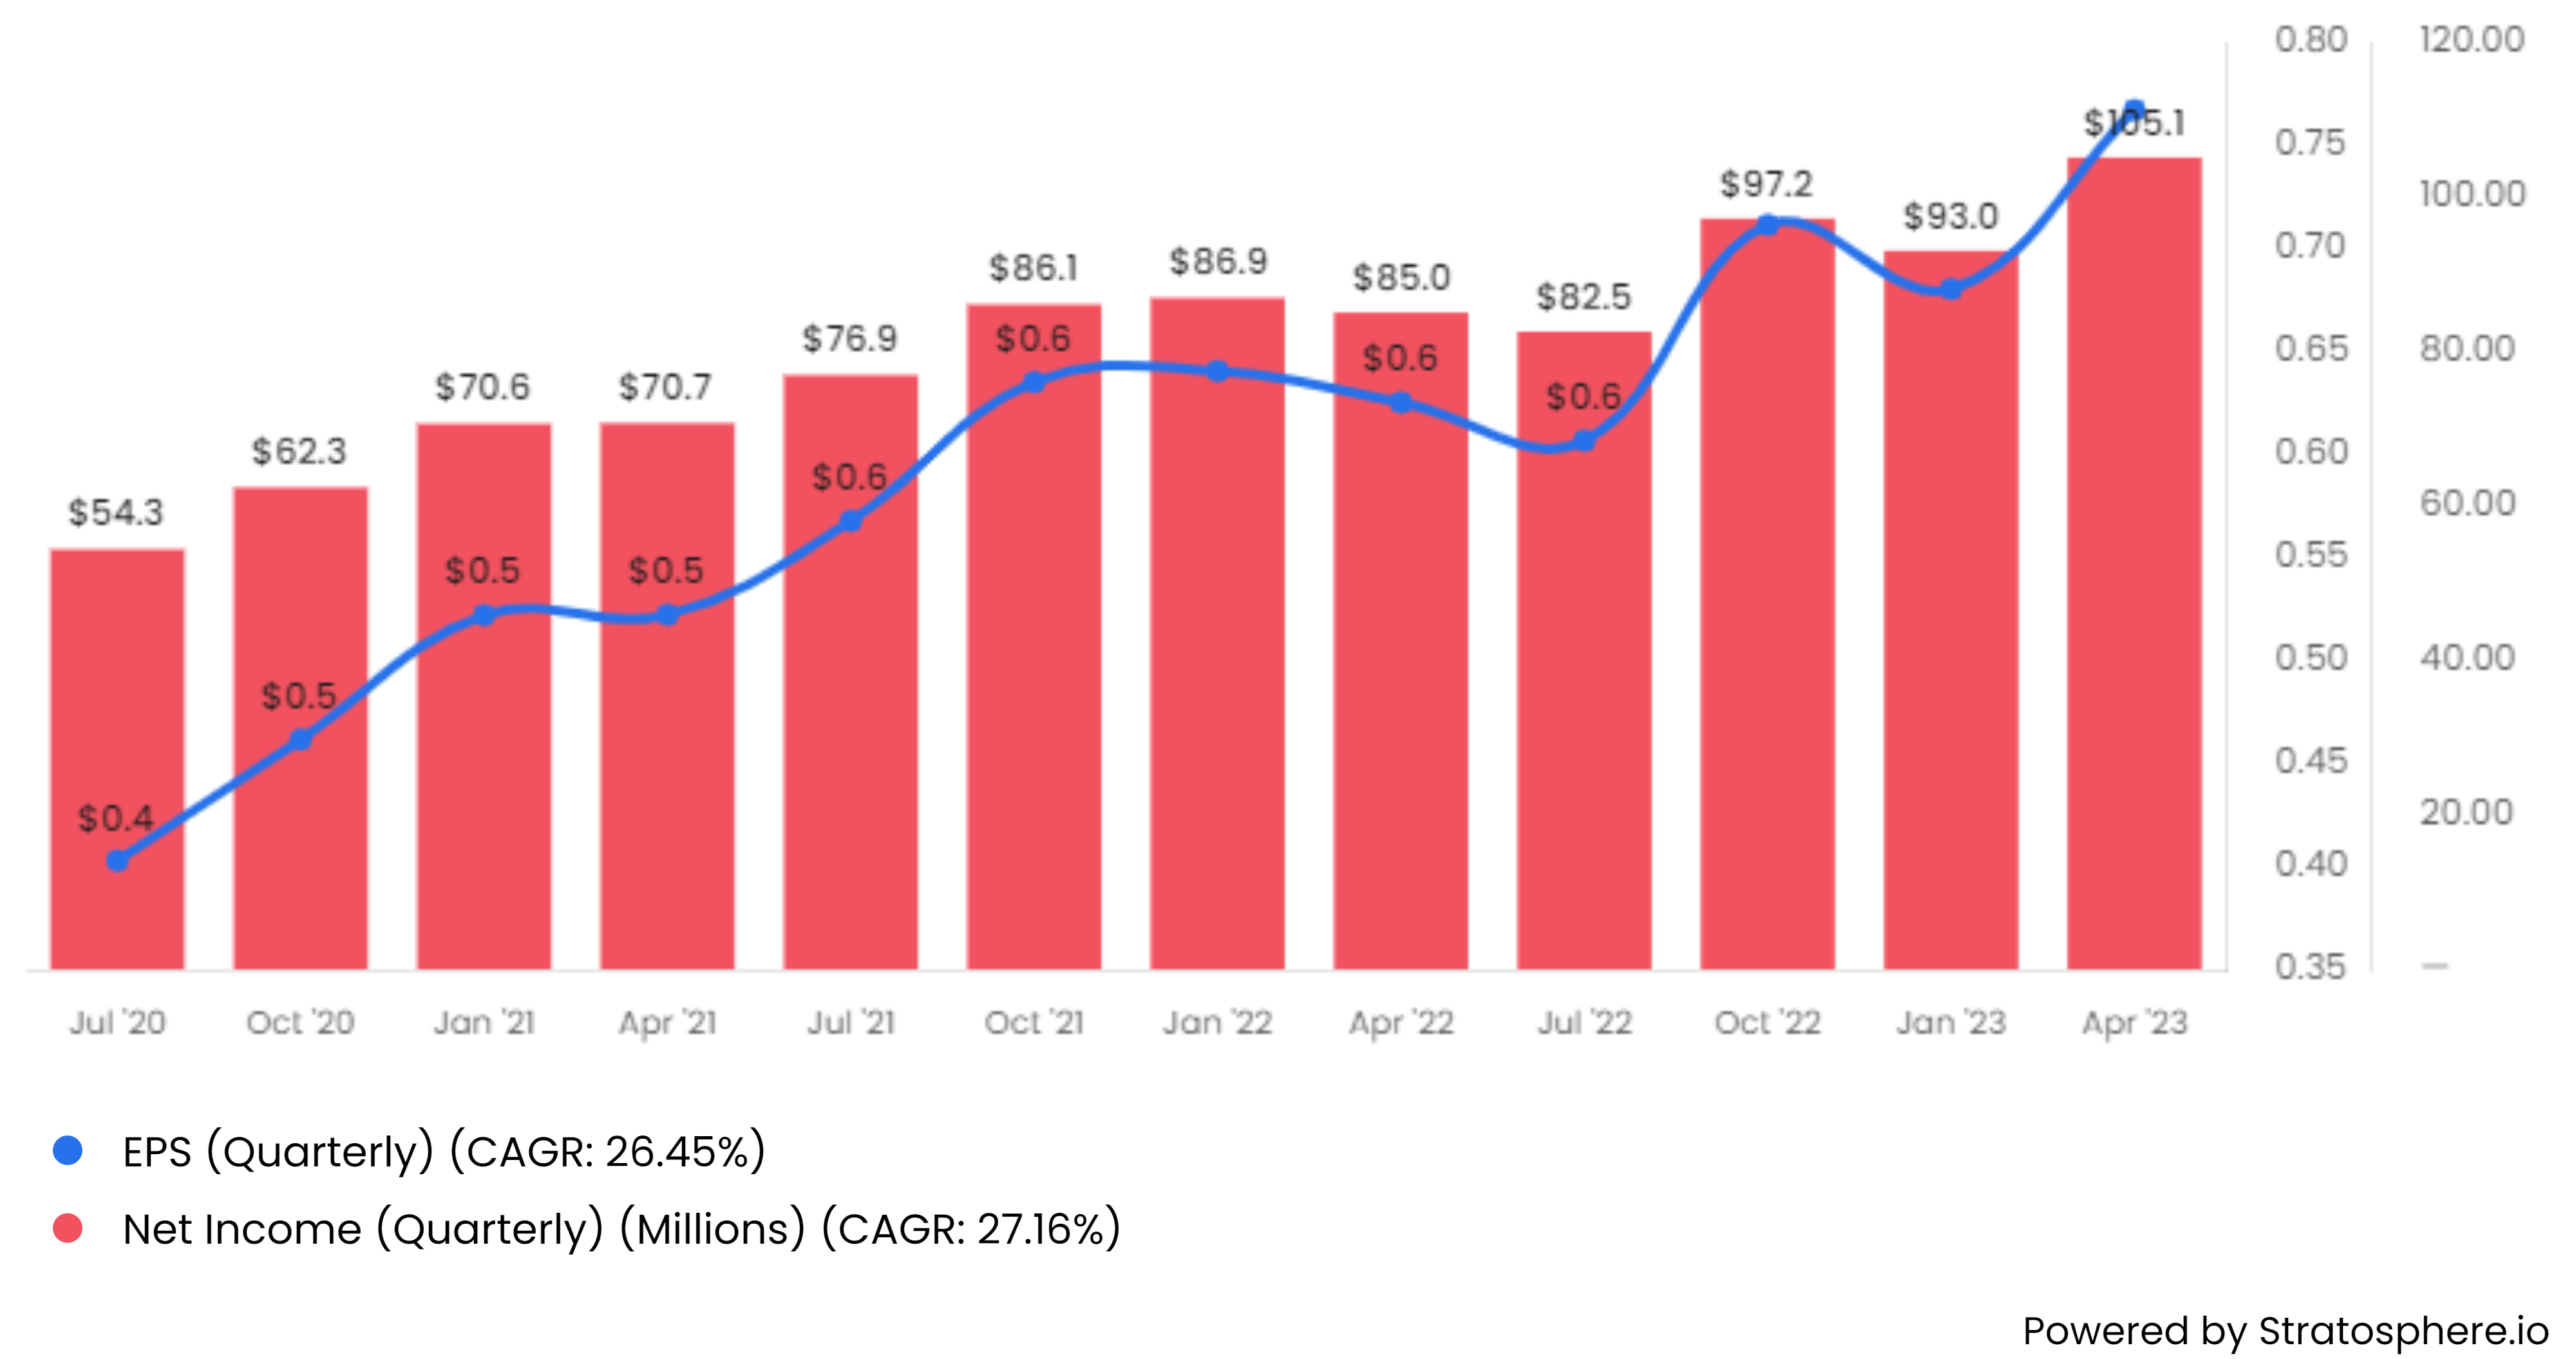
Over the last ten years Net Profits and EPS have grown at a CAGR of ~14.0%. In more recent quarters, the growth has been closer to ~26%
Chart 8 : HEICO’s Return on Equity (ROE) and Return on Invested Capital (ROIC).

HEICO’s ROE and ROIC are at ~11% -12% currently some 500 bps below pre Covid-19 highs.
Chart 9: 10 year Cash Flow from Operations (CFO) and Free Cash Flow (FCF)

In the last 10 years, CFO and FCF have grown at a CAGR of ~14%.
The small difference between CFO and FCF reflects the low level of capital expenditure required in this business (~10% of CFO).
Summary
HEICO has small focused niche with established customers and a successful, time-tested strategy.
HEICO seems to have delivered a strong set of results as it, and the aviation sector, continues a post COVID-19 recovery.
Top line growth of ~ 27% and Net income growth of 18% looks impressive.
Operating Margins have fallen a little but remain above 20% .
Conclusions
HEICO is a well-established company which is growing strongly and generating an a high ROE and strong Free Cash Flows.
The current valuation of the stock is as follows:
Chart 10: Forward Price to Earnings and Forward Price to Free Cash Flows ratio

The Forward P/E Ratio is 57 times while the Forward Price to Free Cash Flow Ratio is ~39 times which implies a Free Cash flow yield of ~2.5% ( 1/39).
Intuitively this feel expensive given the likely rates of growth and current margins and profitability.
Valuations have been at this level for three years but the world has changed in that time as interest rates are no longer near zero but are above 5%. The cost of capital has fundamentally changed and the valuation has not.
Markets look like they are pricing in a long period of higher growth in revenues and profits (including due to the consolidation of the newly acquired Wencor) and a return to pre Covid-19% levels of profitability or even higher (ROE of 18%).
Even in this case, the stock does look overvalued.
We will not recommend an investment now but we will continue to do further work (especially the impact of Wencor) and watch it closely.