Infosys (INFY)
Q3 FY 2025 Results

Infosys (INFY) is India’s second largest (Market Cap $86bn) IT Enabled Services (ITES) Company. We discussed the sector and company before and that report can be found here and here. We also wrote about Accenture (ACN) and Infosys (INFY) recently and that report can be found here. Last week. We also commented on the results of India’s largest ITES company, TCS and that report can be found here.
Introduction
Over the last two or three decades, INFY has grown strongly with an effective cash generative business model. In the last 20 years, the stock has given a CAGR total return of 22%. Adjusting for the approximate average annual depreciation of 3%, the CAGR total return to dollar investors have probably been around 19%. In more recent years, the returns have been a little lower.
The company has a strong balance sheet and a consistent track record for both retaining earnings and returning capital back to shareholders in the form of dividends and share repurchases.
The sector had a difficult time growing revenues in the last 18 months as client budgets have been flat and discretionary spending has been restrained. We noted in our report on Accenture on December 29th 2024, their most recent quarterly earnings growth was just 2.7%.
INFY’s clients include companies/ organizations like Daimler Mercedes-Benz, HSBC, Goldman Sachs, J&J, Accenture, US Army, US Navy, Lockheed Martin, IBM Corporation, Deutsche Bank etc.
INFY 10-years Financial Summary
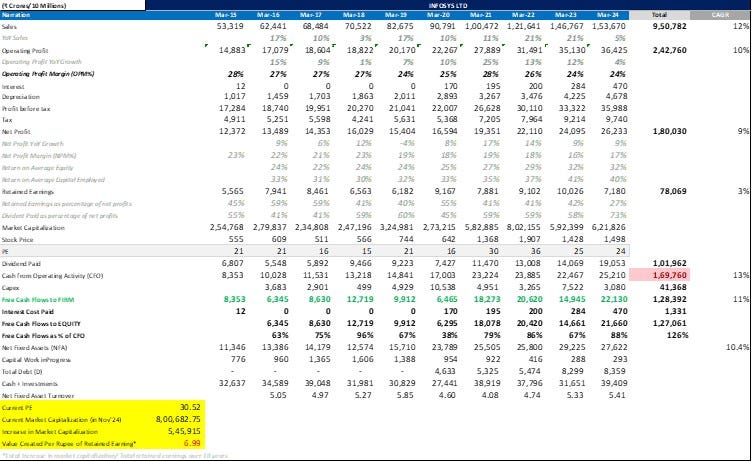
The slide above gives a good snapshot of select INFY numbers in the last ten years. The numbers are in Indian Rupees but the final column, which shows the CAGR percentage growth rates, is easily understandable.
In the last ten years Revenues and Operating Profit have grown at CAGR of 12% and 10% respectively. Over the same period, Net Profit has grown at a CAGR of 9%. As we noted in our earlier reports on, the industry model does not have significant operating leverage as you have to hire people if you want to grow revenue. Costs move up in line with revenues and operating margins are broadly stable.
Cash Flow from Operations have grown at CAGR of 13% over the last ten years.
The second last column (in the slide above) shows the ten-year cumulative data for select items on the Income Statement.
The cumulative ten-year Net Profit is INR 180,030 crores ($22.2bn). (A crore is 10mn). The cumulative cash flow from operations is also shown in this column and it is INR 167,770,784 crore ($19.7bn), almost identical to the cumulative Net Profit figure. This indicates INFY has little difficulty in generating cash equal to reported net profit.
Operating Profit Margin is around 24% while Net Profit Margin is 17%.
Return on Equity and Return on Capital Employed reached 32% and 40% respectively in FY 2024
Towards the bottom of slide above, we see that INFY’s total debt of INR 8,359 crores ($990mn) is dwarfed by Cash and Investments of INR 39,409 crores ($4.6bn) so INFY is cash rich and negative net debt.
We also highlight the last unit in the slide above which is highlighted in yellow. This shows the value created per each rupee of retained earnings is 7.0 rupees. This metric is based on a Warren Buffett idea. He outlined the circumstances in which a company should retain earnings beyond those needed for necessary capex, rather than distribute it to shareholders.
“For a number of reasons, managers like to withhold unrestricted, readily distributable earnings from shareholders – to expand the corporate empire over which the managers rule, to operate from a position of exceptional financial comfort, etc. But we believe there is only one valid reason for retention. Unrestricted earnings should be retained only when there is a reasonable prospect – backed preferably by historical evidence or, when appropriate, by a thoughtful analysis of the future – that for every dollar retained by the corporation, at least one dollar of market value will be created for owners. This will happen only if the capital retained produces incremental earnings equal to, or above, those generally available to investors.”
If we apply this test to INFY, we can see that over the last ten years, INFY has retained and reinvested INR 78,069 crores ($9.2bn). Over the same period, the market cap has increased by INR 545,915 Crore ($64bn or 7X). Hence our assertion that each Rupee retained by INFY has created 7 rupees of value for investors – an excellent performance.
Q3 Quarterly Results
Client budgets are usually decided in January / February and ITES companies only have visibility in March. The 3rd quarter (to end December) is a seasonally quiet quarter. Even If budgets are constrained, there may nevertheless be some discretionary spending especially if there have been some great than expected savings elsewhere.
Infosys raised its annual revenue forecast for the third time this financial year as its U.S. banking and retail clients warmed up to spending more on discretionary projects.
The sentiment echoed that of market leader Tata Consultancy Services and smaller rival HCL Technologies which also highlighted early signs of discretionary spending picking up and an improvement in the demand environment.
The company now expects its annual revenue to rise by 4.5%-5%, up from its prior outlook of 3.75%-4.5%. This is better but still less than the average ten years growth noted above.
Revenue in the quarter rose 7.6% to 417.6bn rupees ($4.83 billion), beating the analysts' average estimate of $412.8n.
That helped Infosys's third-quarter net profit rise 11.5% to 68.1 bn rupees ($801mn), topping the analysts' average estimate of 67.3bn rupees ($792mn).
Large order bookings, or deals over $50mn, stood at $2.5bn during the quarter, versus $2.4 bn in the previous quarter and $3.2 billion in the year-ago period.
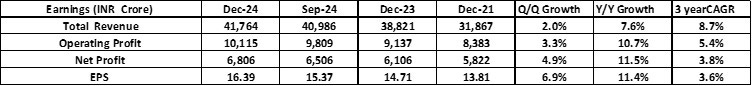
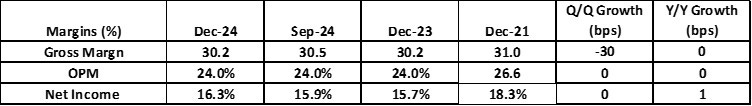
Q3 Revenue growth was 2.0% (q/q) and 7.6% (y/y) - a reasonable performance in a seasonally weak quarter. Operating and Net Income Margins have been relatively stable at 24% and 16.3% respectively.
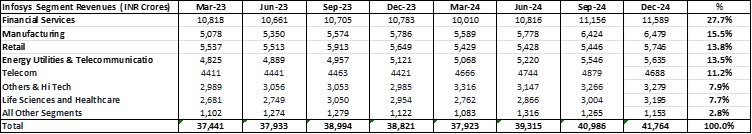
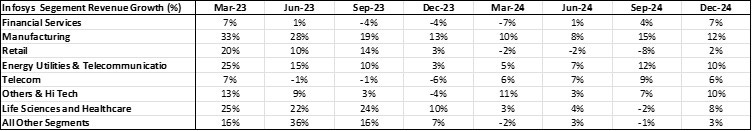
In terms of segments, Banks, Financial Services and Insurance (BFSI) companies have been large spenders on technology services and they account for 28% of revenues. However, BFSI budgets have been constrained and this segment only grew 7% in Q3. BFSI is followed by Manufacturing, Retail and Energy Utilities & Telecom.
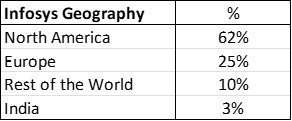
In terms of Geography, Infosys is more dependent on North America than TCS (62% vs 52%) North America is by far the largest market followed by Europe. The whole sector benefits from INR depreciation as most costs are in Indian Rupees but almost all revenues are in foreign currencies.
Highlights of the Earnings Conference call
General Trends
We saw double digit growth in Europe and India and in our manufacturing business.
Large deals were at $2.5bn, operating margin at 21.3%.
Free cash flow for the quarter was at an all-time high of $1.26bn
Financial Services in the U.S Continues to grow strongly in this quarter and over the past few quarters. We have seen a revival in European Financial Services during Q3.
We're seeing an improvement in retail and consumer product industry in the U. S.
Demand trends remain stable in other industries with clients continuing to prioritize cost takeout over discretionary initiatives.
AI
Clients are turning to us as the partner of choice when it comes to enterprise AI to transform their business for growth and to manage operations more efficiently.
We are leveraging Infosys Topaz to showcase enhanced business value in predictive analytics and real time insights and strategy decision makers.
Topaz is their AI powered services and solutions suite.
We have built 4 small language models for banking, for IT operations, for cyber and for enterprises broadly. These small language models have 2.5bn parameters. These models are built using some of our proprietary data sets.
We are developing over 100 new generative AI agents for deployment within our clients. This expands the opportunity that we have to do this sort of work. So, at this stage, it looks to us like this will give us, over time, more growth.
We're working closely with the generative AI partner ecosystem to develop joint solutions for our clients, several of them on the platforms of the partners.
Some examples of the work in the generative AI area.
1. We developed a generative AI powered research agent that generated comprehensive solutions within seconds for requests made for the product support teams of a large technology company.
2. We have created 3 audit agents to intelligently automate multiple tasks for a professional services company.
In addition, they said they have several live or production examples and not just at the proof of concept stage.
What we are seeing is the agents are helping clients to achieve benefit by the time reduction, cost reduction or greater impact in their customer base and growth. And they're being done in a broad-based way within the client.
At this stage, we're seeing a broader set of opportunities, while overall scale is small, but it's looking like there'll be more opportunities in this area.
Demand Trends
North America continues to be strong especially in financial services.
North America returned to positive growth trajectory after 4 quarters, growing at 4.8%. Financial Services in U. S. continues to see discretionary spend increase in capital markets, mortgages, cards and payments, which led to another quarter of volume growth.
Clients have started to view IT investments more favourably post-election related uncertainty and interest rate cuts in recent months. While the focus remains on cost optimization, spending towards new growth areas like AI, cloud adoption, cybersecurity data and analytics is observed.
One surprise perhaps was the strength in Europe.
Europe grew at 12.2% (y/y), twice the company level. We have also seen a revival in Europe leading to Q3 backed by some large deals.
Financial Services saw 3rd consecutive quarter of volume growth, reflecting continued positivity we are seeing in the sector.
Manufacturing continues to see weakness in the automotive in Europe. However, there is a continued momentum in areas such as engineering, IoT, supply chain, cloud ERP and digital transformation.
Communications sector continues to face volatile macro environment, leading to growth challenges and driving Operating Expense pressure. Discretionary spending continues to be soft and current year growth is driven mainly by recent large deal wins focused on efficiency and consolidation.
We are seeing some signs of recovery in discretionary spend in the Retail and CPG verticals in the U. S.
Although ITES is a competitive business, pricing pressures are stable as clients consolidate to using smaller number of vendors.
The pricing environment per se across at least what we are seeing in the industry is stable at this point. The benefits of vendor consolidation are being more apparent contributing to the growth of existing accounts and the establishment of new relationships. The pipeline is healthy with a mix of large and small deals and a focus on cost to account and portfolio rationalization.
They saw good momentum in getting new contracts
Large deal Total Contract Value (TCV) for the quarter was at $2.5bn, 63% of this being net new, which is an increase of 57% in net new deal TCV. Our large deal pipeline has become stronger in Q3. Vertical wise, we signed 5 deals in financial services, 4 in communication, 3 in manufacturing, 2 each in retail and 1 in high-tech. Region wise, we signed 11 large deals at America and 6 in Europe. This also includes a BOT (build operate and transfer) deal with a client to set up a GCC (Global Capability Centre) in India.
Workforce recruitment and utilisation
As noted before, the ITES business model has little operating leverage. If you want to grow revenues, you have to hire more people so costs tend to grow roughly in line with revenues.
Net headcount addition continued for 2nd consecutive quarter. We added 5,591 employees this quarter. For the year, we will hire 15,000 plus freshers in line with our original commentary. And for the next year, we are expecting 20,000 plus.
15k to 20k employees is an addition of about 5%-6% per annum to the workforce. The net addition may be less due to attrition which is an important issue for the industry. However, it is broadly consistent with the forecast revenue growth of 4.5% to 5% in FY 2025.
Another key metric is Utilisation. Workers need to be deployed on revenue earning projects. However, some idle bench strength is required for flexibility. The company noted that utilisation is currently at 86%.
We have generally said 83% to 85% of utilization is the range that we are more comfortable with. 86% is a little bit above our comfort level.
Free Cash Flow Strength and Conversion
Free cash flow generation has always been a strong feature of Infosys and ITES business model.
Our free cash flows were at $1.26 bn, up 51% (q/q) and up 90% (y/y). Our free cash flow, excluding tax refund as a personnel net profit for the quarter, is at 123% and for the 9 months is 109%, which is the highest conversion in over 2 decades.
North America accounts for 62% of their revenues. They are trying to diversify geographically.
Our expansion beyond the U. S, specifically into Nordics, Middle East and Southeast Asia is also contributing positively to our growth.
The company and the sector face a revenue growth challenge. It is going to be hard to get back to the high single digit to low double-digit percentage revenue growth they saw in the last ten years.
The days of high double digit revenue growth seen twenty plus years ago are unlikely to return. This is due to growing size. These companies, plus competitors like ACN and CTSH are now very large companies. They have grabbed low hanging fruit and it is harder to grow revenues from this point.
Relative Valuation
The table below shows some valuation parameters for some large and mid-sized Indian It companies.
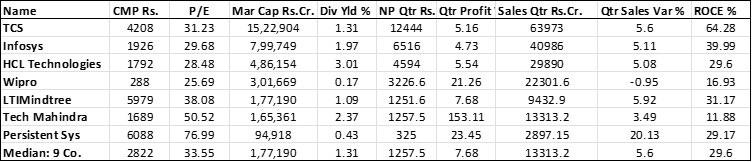
INFY has the second highest ROCE but also the second highest current P/E Multiple. The median P/E multiple of the nine companies is 33.6X.
Summary
Infosys is large established company in a well-known sector. They are very profitable (ROE=32%) and highly cash generative. However, revenue growth is a challenge and the business model has little operating leverage.
Valuation
The current analysts’ consensus forecasts for revenue, net profit and EPS are as follows:
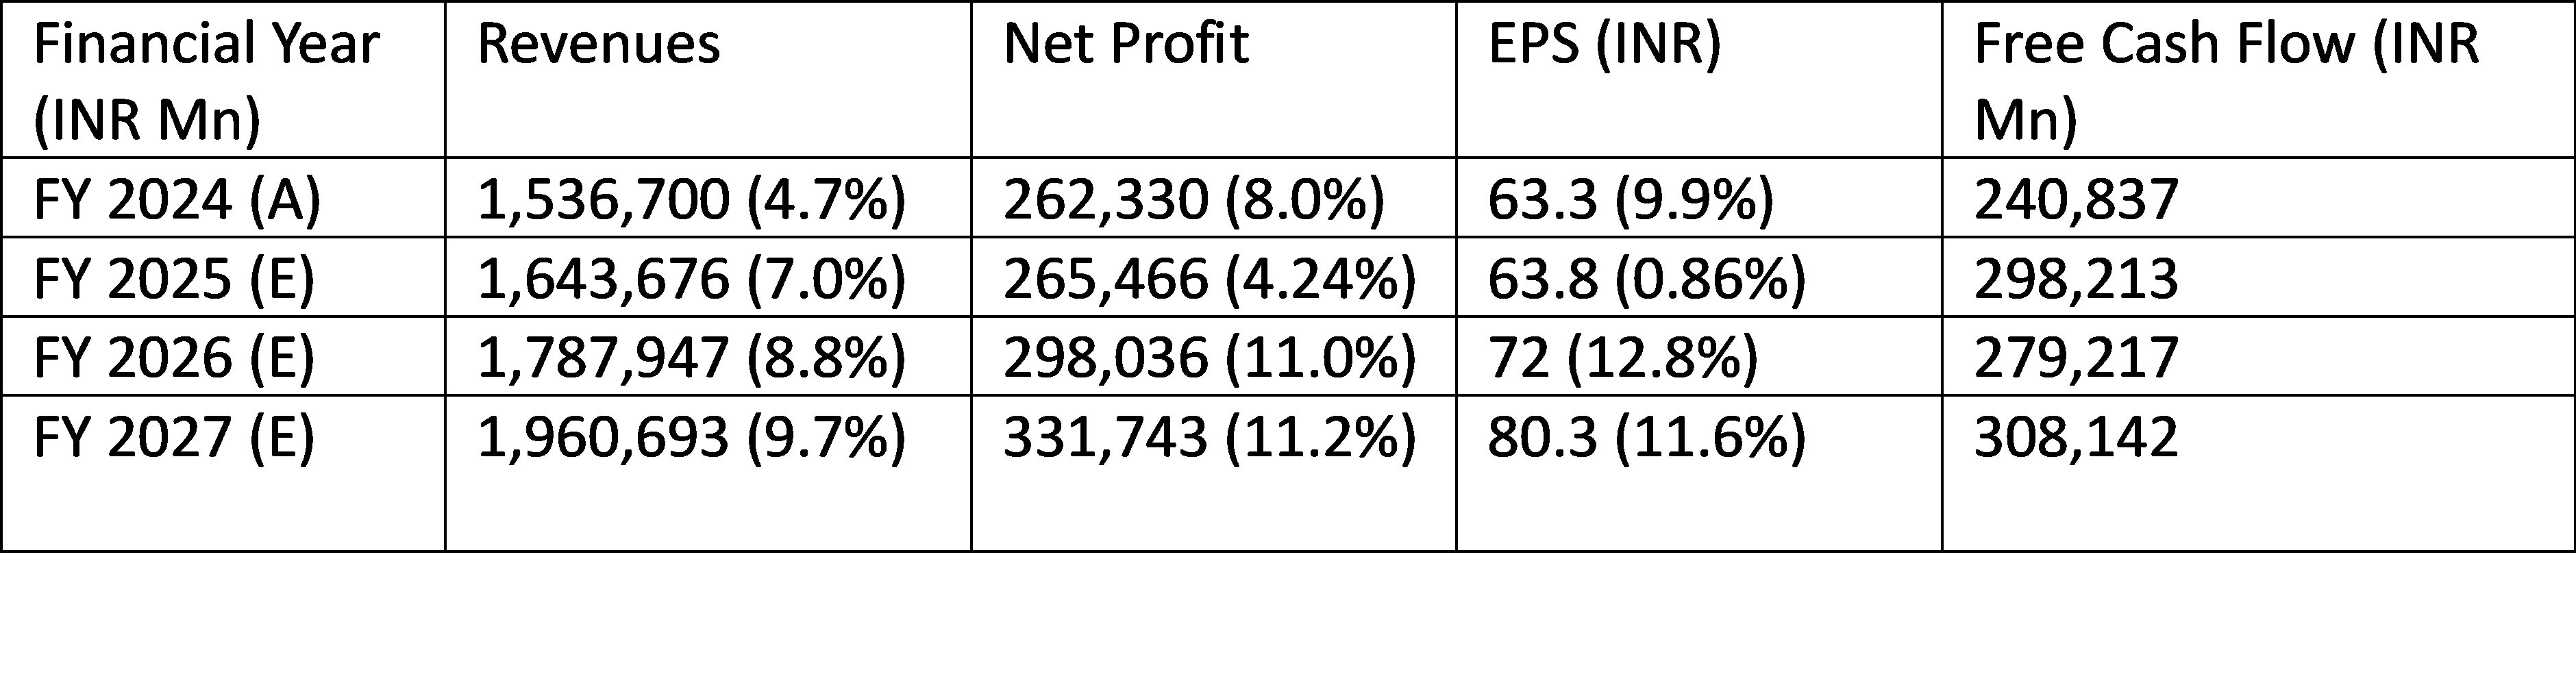
In FY 2025 to FY 2027, analysts are relatively optimistic, expecting high single digit percentage revenue growth and low double digit percentage Net Profit and EPS growth. In other words, they are expecting an upward reversion to the 10-year historical averages.
Infosys share price currently is INR 1800 and that implies a two year forward P/E multiple of 25X. This implies a two-year forward earnings yield of 4%.
The current market capitalisation is INR 7.4trn ($86bn) which implies a two year forward Price to Free Cash Flow Ratio of 26.5X.
This appears to be a fair valuation given Infosys’s likely 8%-10% growth in revenues and likely ROE/ ROCE of 30% to 32%. However, it is definitely cheap.
DCF Valuation
We supplemented this valuation with the Discounted Cash Flow (DCF) Valuation model. We made a number of assumptions to derive the DCF valuation including the following:
Revenue Growth
We assumed 10% revenue growth in the three years to FY 2025-27, a little higher than the consensus analysts’ estimates noted above.
We further assumed revenue growth would slow by 1% per year between 2028 and 2032. After 2032 we assumed a steady rate of revenue growth of 5% per annum.
Discount Rate
The percentage rate used to discount future free cash flows is the Weighted Average Cost of Capital (WACC). WACC is derived from the cost of debt and the cost of equity capital. Infosys has a cost of equity capital of 12.0% and a post-tax cost of debt of 3.14%. It is 99% funded by equity and only 1% by debt. Therefore, the WACC is estimated to be 11.9%.
INFY Stock Beta
We calculated the beta using three-year weekly data for the Nifty Index and the Infosys share price and derived a Beta of 0.93.
DCF Output
The net result of the DCF was a theoretical valuation of the Infosys share price of INR 1300, some 27% below the current share price. This suggests the stock is a little overvalued. We cross checked with the Website: https://www.alphaspread.com
This uses two methods to work out the intrinsic value of a stock. They take a DCF and a Relative Valuation measure and take the average of the two as their estimate the m of the intrinsic value of the stock.
We did not check their assumptions. They report a DCF estimate for Infosys of INR 950 per share and a Relative Valuation method value of INR 1913 per share. The website’s estimate of intrinsic value is the average of the two which is INR 1413 per share, a 20% overvaluation compared with the current price.
These results are not surprising. Our random survey of valuations of some Indian companies suggests, most of the them are overvalued. This is not surprising as the NIFTY 50 index has risen for nine years in a row. Local monthly flows into Mutual Funds have grown strongly and this money has to be invested in the local market. This liquidity-driven buying has driven up valuations of most stocks.
Conclusions
Infosys and TCS are both good business which are likely to reliably give average rupee returns of 15% to 18% CAGR over the medium term. However, the problem is that the whole market including the ITES stocks are overvalued currently. We cannot forecast what crisis (if any) will bring whole market valuations lower and, indeed, we do not know when this will happen (if at all).
We have a long-standing position in the Infosys ADR and will continue holding this. We will not add to it. We will continue to monitor the valuations of the sector and the market closely.