Meta Platforms (META)
Q2 Results
We have written a few times on Meta Inc ( formerly Facebook) which can be found here, here and here.
We are taking another look at in the light of its most recent Q2 results.
Introduction
Almost all of Meta‘s revenues come from advertising. Their goal is to maximise the number of people on their platforms (Facebook, Threads, Instagram and WhatsApp aka the Family of Apps (FOA)) and maximise the time they spend on these platforms.
Meta needs user engagement to result in ad impressions and needs to convert the impressions into revenue. Success is a function, among other things, of how well-targeted the adverts are. The quality of the targeting depends on the amount of data Meta has on its users.
Meta no longer breaks down users for each app but for the whole FOA, the number of Daily Active Users (DAU) is 3.24bn people and annual revenue per user is about $44. Monthly Active Users (MAU) data will no longer be released but it was at 4bn at end 2023. This gives the approximate annual revenue run rate of $ 176bn (4bn x $44).
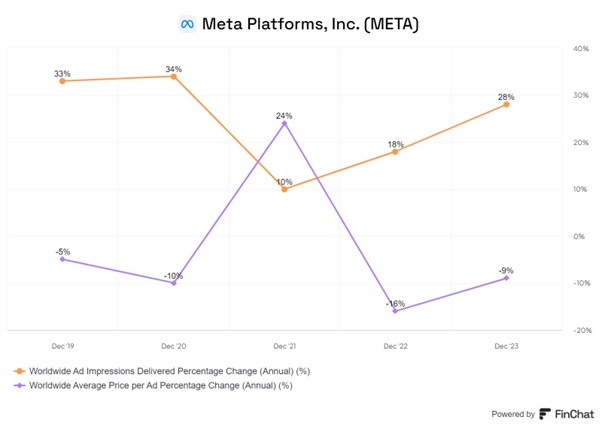
The number of ad impression grew at 28 % last year but the revenue per impression fell 9% so net advertisement revenue growth of ~16%
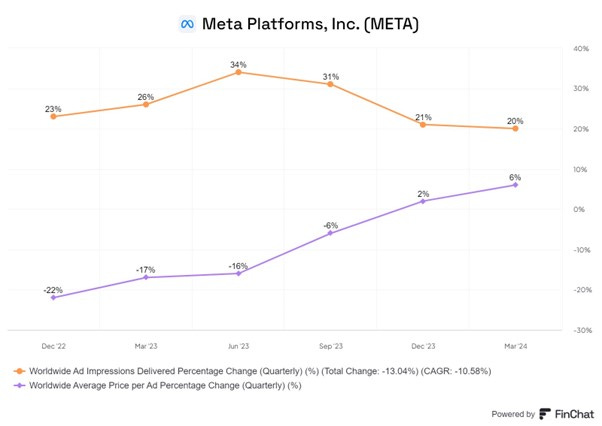
In the most recent quarter, ad impression numbers grew by 20% and revenue per ad impression also grew (by 6%) which points to revenue growth of ~26%. One key questions is whether they can continue to increase the revenue per ad impression.
Detailed Q1 Numbers
The rest of this report is behind the paywall and only available to paying subscribers. Please do consider subscribing. The cost has been set at the lowest level permitted by Substack and it is the equivalent of one cup of coffee a month.
Keep reading with a 7-day free trial
Subscribe to Long-term Investing to keep reading this post and get 7 days of free access to the full post archives.


