Netflix Inc (NFLX)
A Streaming Giant
We write this general note in the light of Netflix latest quarterly results. We do not cover the results in detail as this has well covered elsewhere.
Introduction
Netflix, Inc. (NFLX) is a provider of an Internet-based television network. It started in 1997 as a subscription DVD-by-mail service in the U.S. That innovative service ultimately drove movie rental giant Blockbuster out of business. The legacy DVD service was closed in October 2022 after 25 years in operation.
Netflix began a streaming video service with licensed movies and TV series in 2007. This is what they prophetically said at the time.
“We also anticipate the emergence of a significant downloading market once two primary hurdles are cleared: the availability of deep and compelling content and the technological challenge of getting the content from the Internet to the TV, where people want to watch it. We are absolutely focused on positioning Netflix to lead this market. It’s important to remember that downloading is just another way to deliver content, an alternative to the mail, or the local video store, or to cable, or to satellite delivery. The winners in downloading will be the companies that provide the best content and the best consumer experience, and that’s what we do best.”
NFLX was not content to be just a distributor of other people’s programming but wanted to produce content. It released its first major original series, "House of Cards," in February 2013, and has since become a major content player and seen as a “threat to Hollywood”.
Netflix offers a subscription video-on-demand (SVOD) service in over 190 countries. Members can watch original series, documentaries, feature films, as well as television shows and movies directly on their Internet-connected screen, televisions, computers, and mobile devices.
NFLX is a key beneficiary and driver of the disruption of linear TV and cord cutting as viewers cancel contracts with cable companies and switch away from traditional broadcasters to streaming companies offering SVOD.
NFLX is benefiting from the global proliferation of broadband, Internet-connected devices and increasing consumer preference for on-demand video consumption over the Internet. Its growth from 2007 was only possible because Amazon rapidly developed AWS and offered large-scale Cloud hosting capacity to outside customers. Netflix was, and remains, one of the most important customers of AWS.
NFLX had 270mn paid subscriptions by end-March 2024. This translates to over 650mn global viewers, assuming 2.5 viewers per subscription.
For about 8-10 years to 2022, NFLX has been strongly focused on growing its global subscriber base. It has invested in global content including local-language original content production. This investment in content was funded in a large part by bonds issued by the company.
Since it started its original content push, Netflix has launched quite a few hit shows. They include "Stranger Things," "The Crown," "Squid Game," "Wednesday," "Ozark" and "Bridgerton."
It also has premiered popular original movies such as "Bird Box," "Extraction," "Murder Mystery," "The Old Guard" and "Red Notice."
Recent well-received shows on Netflix include TV series "3 Body Problem," "Avatar: The Last Airbender" and "The Gentlemen."
NFLX has considerable leverage in its model as higher subscription revenues have a disproportionately larger impact on profit against relatively fixed content costs.
Streaming entertainment is expanding rapidly because of:
Ecosystem Growth: internet is getting faster and more reliable, while penetration of connected devices, like smart TVs and smart phones is also rising.
Freedom and Flexibility: Consumers can watch content on demand, on any screen, and the experience is personalized to individual tastes.
Rapid Innovation: streaming entertainment apps have frequent improvement updates and streaming is the primary source of UHD 4K video content.
Amazon Web Services (“AWS”) provides a distributed computing infrastructure platform. Netflix has designed its software and computer systems to utilize data processing, storage capabilities and other services provided by AWS. Netflix was one of the first and one of the largest customers of AWS,
The business model is relatively easy to understand. The company’s only source of revenues is membership subscriptions. This is a product of the number of members or paid subscribers and the average revenue per member (ARM)
As the chart below shows, the strategy to grow paid memberships has been successful. The rate of growth has slowed in the last two or three years.
Chart 1: NFLX Global Paid subscriptions 2014-2022
Source: The Science of Hitting Substack
Chart 2: NFLX Global Paid subscriptions 2022-2024
Source: Finchat.Io
Paid memberships have grown to 270mn, but net quarterly additions have been relatively low (the blue bars in chart above).
Table 1 : Netflix Operating costs breakdown per subscriber
Source: The Science of Hitting (TSOH)
The average revenue per member (ARM) at the end of 2023 was $ 137. Total annual revenue in 2023 was about $ 32bn (~260mn X 137).
The money spent on programming is not immediately expensed on the P/L of the company. Instead, it is shown as an asset ("Non-current content assets) for the company as these films/ programmes will “earn” revenues for a few years
The programme assets (whether licensed or produced in-house) are amortised every year and this expense is shown in the P/L it is shown as Cost of Goods Sold (COGS). in 2023 COGS was $80 per subscriber.
“Licenses and production are amortised over the shorter of each title's contractual window of availability or estimated period of use or ten years. The amortization is on an accelerated basis, as they typically expect more upfront viewing. 90 % of such assets are expected to be amortised over four years.”
This suggests the average accounting life of the assets is likely to be just over four years.
We can debate whether this depreciation policy is appropriate. It could be argued, that since the “Produced” in-house assets can stay on the platform for a long time, an average life of 4 years is too low. In this case the reported COGS is too high and reported profits are too low.
On the other hand, many programmes are not evergreen classics and the bulk of the viewing a new programme (or series of programmes) will occur in the first eighteen months. In this case, assumption that assets’ average life is four years may be too high and the true depreciation is higher. In this case, COGS is too low and reported profits are too high.
In addition to COGS, the other components of operating costs are Tech and Development, Marketing, GAA, and other Operating Expenses. These are shown in the table above. After these costs are deducted, the annual EBIT per Subscriber can be derived. In 2023, this was at $ 28 per subscriber.
This means total EBIT in 2023 was around $ 6.9bn ($28 * 246mn). This is an EBIT margin of about 20%
Chart3: NFLX Total Revenue and Operating Income 2014- 2024
The growth in Annual Revenues and Operating Profit can be seen in Chart 3 above. There was a strong boost to revenues during the COVID lockdown era. Revenue growth has been more challenging in the last two years. Operating Income has grown strongly in the last five years.
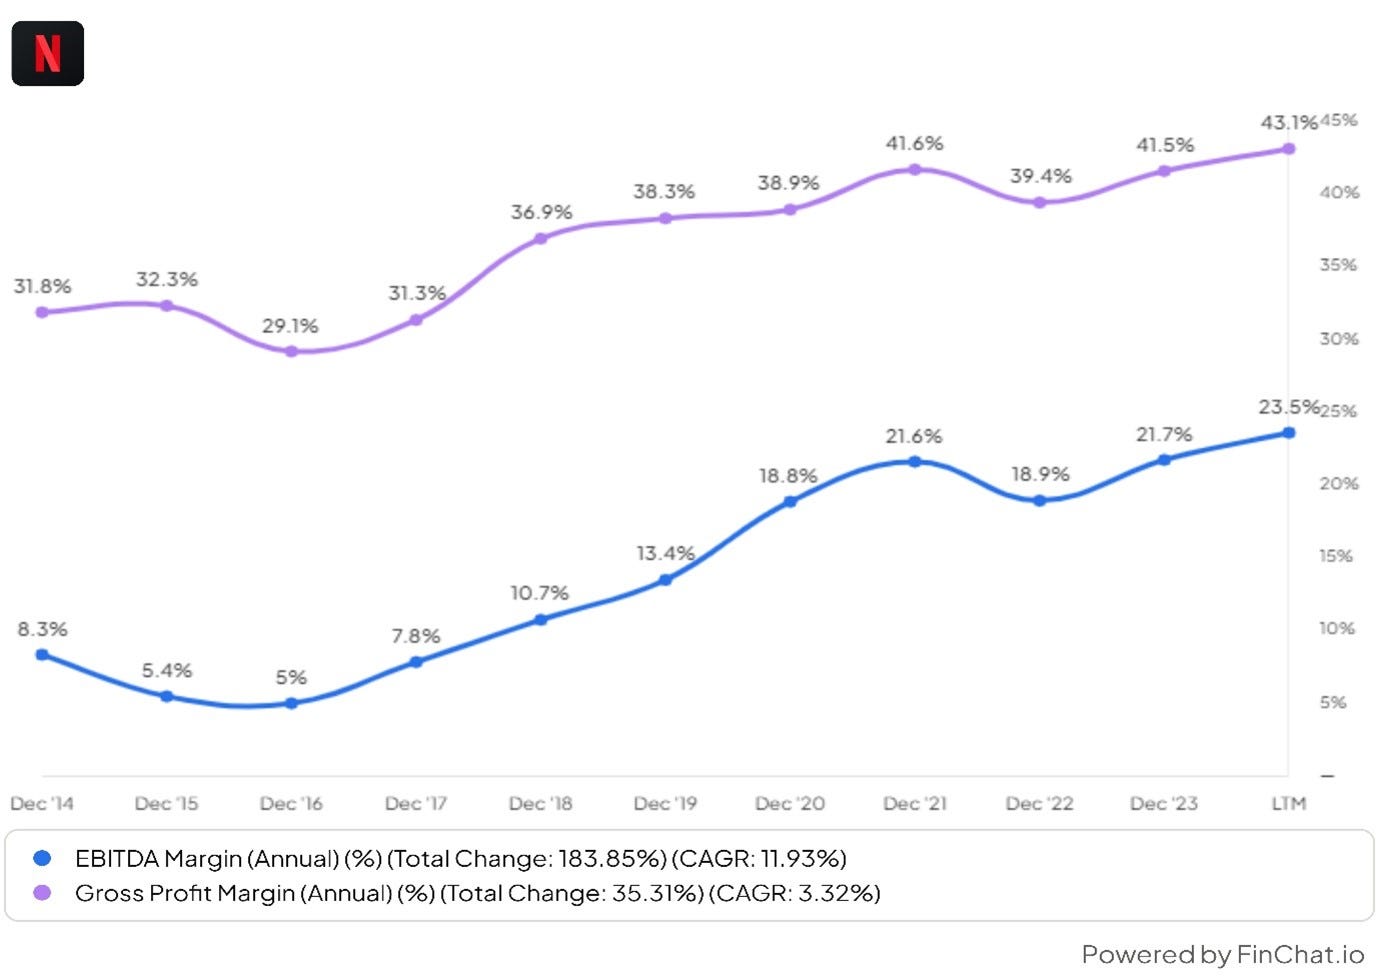
Chart4: NFLX Gross Profit Margin and EBITDA Margin 2014- 2024
Gross Margins is at around 40% and Operating Profit Margin is at a~21%.
For about 6 to 7 years, the company was a significant issuer of debt. The NFLX did not have an investment grade debt rating and these bonds were higher yield or junk bonds. They were issued to raise fund for the creation of original content. NFLX sought to outspend Hollywood studios and build an enticing catalogue.
The chart below shows the annual issuance of debt every year.
Chart 5: NFLX total debt issued 2014- 2020
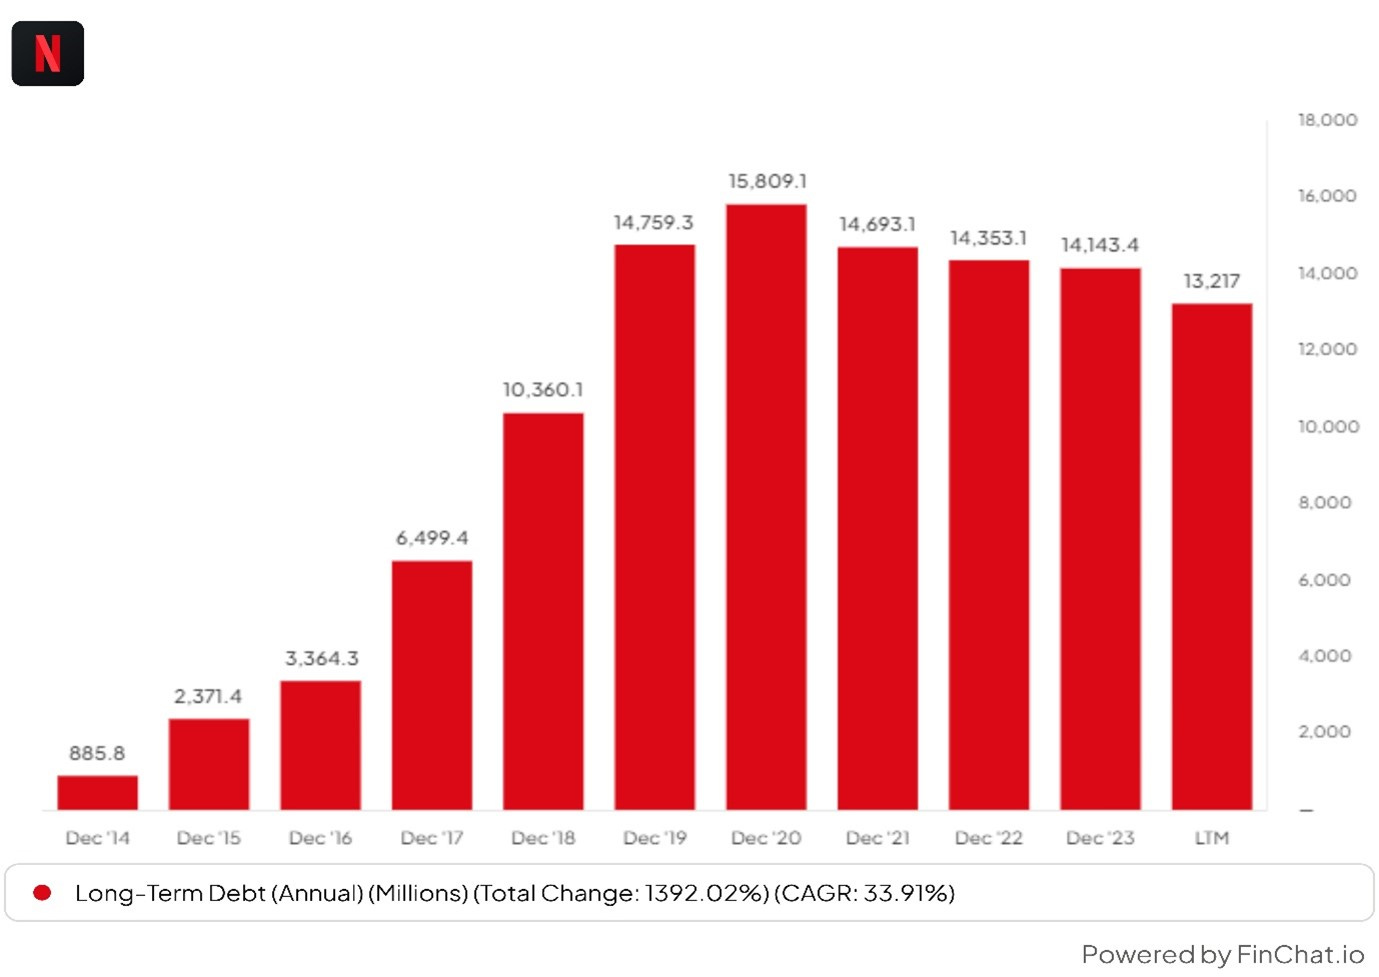
Chart 6: NFLX total debt 2014- 2023
Long term debt increased from just $ 890mn in 2014 to $ 15bn in December 2020 but has fallen a little since.
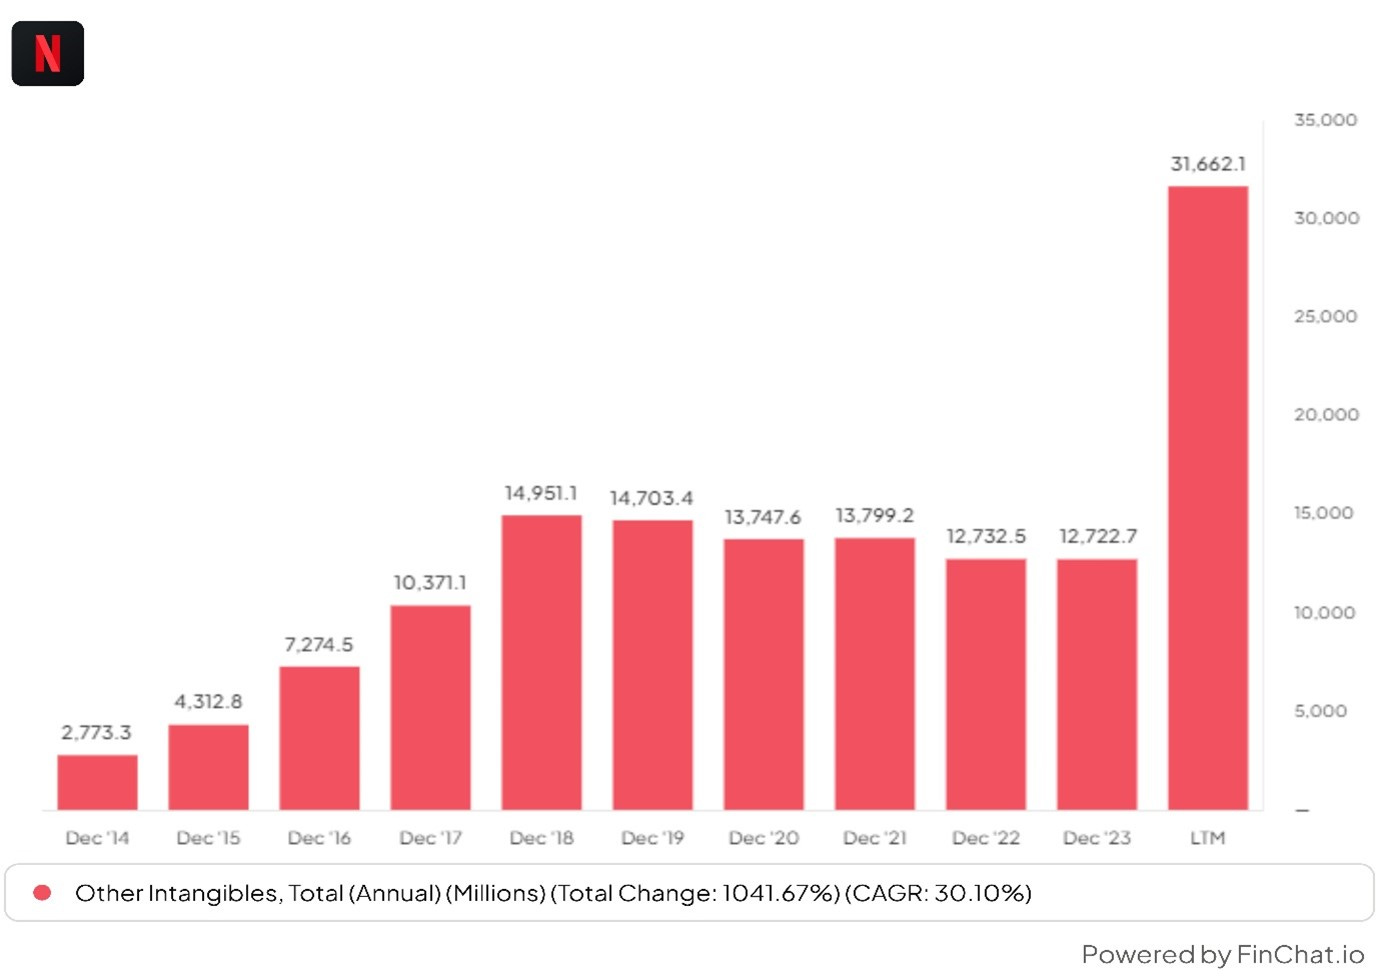
This money was used to finance original film production and this can be seen in the growth of other intangible assets on the balance sheet. (see chart below)
“ We went from essentially zero to one of the biggest content producers on the planet in ten years. Our goal was, “go as fast as we can until the wheels are wobbling off the car and then moderate a little bit from there”.
Chart 7: NFLX Total other intangible assets 2014- 2023
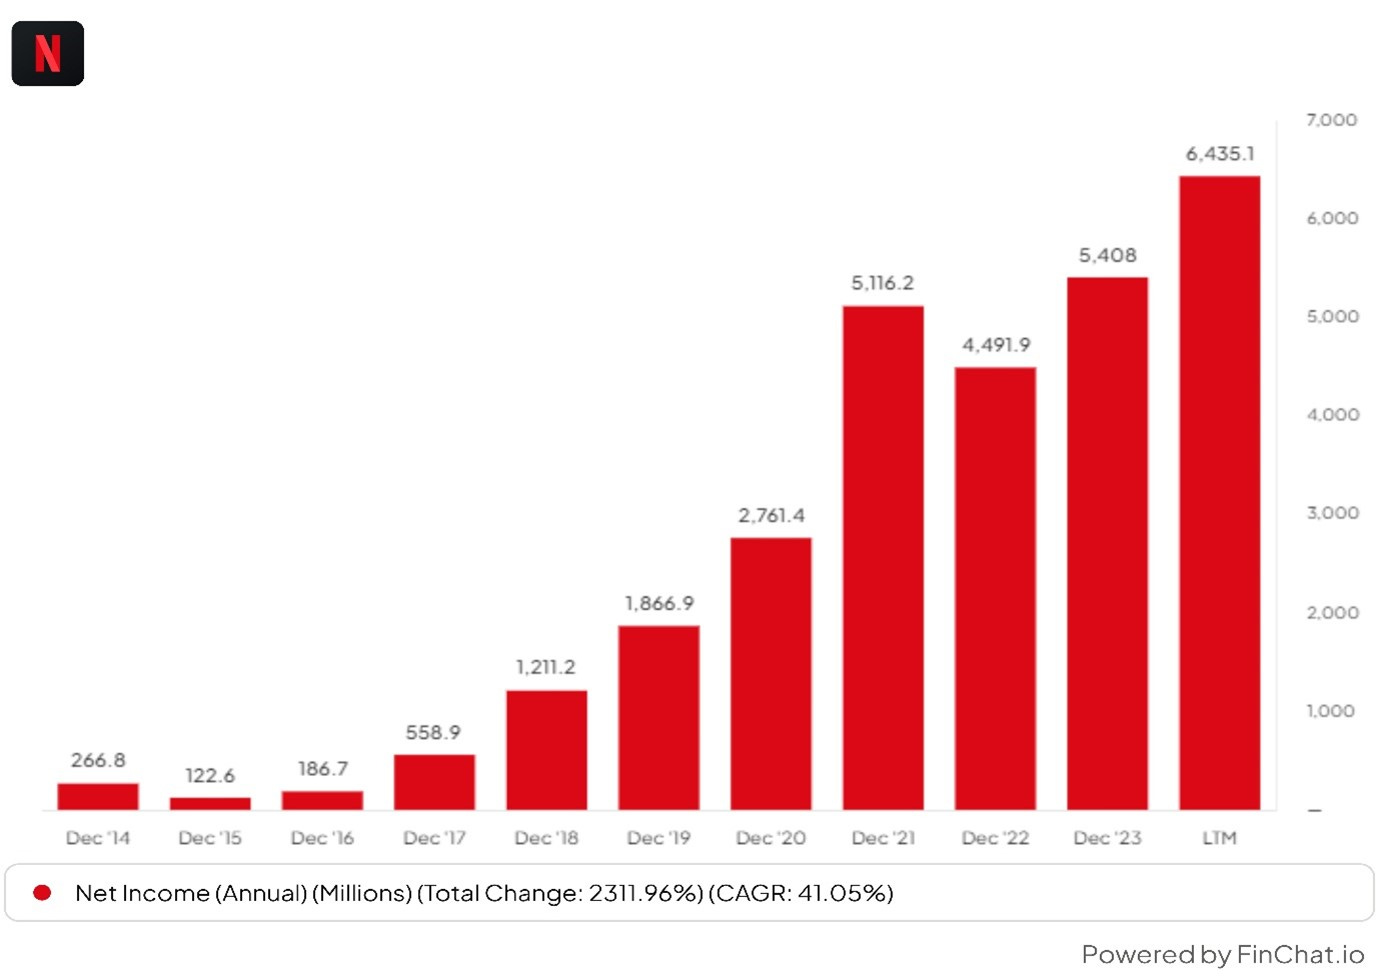
Chart 8: NFLX Annual Net Income 2014- 2023
Net Profit was negligible until 2017 but has grown steadily since then. As revenues have grown and a large part of costs are fixed, operating leverage has kicked in and a higher percentage of new revenues are feeding through to profits.
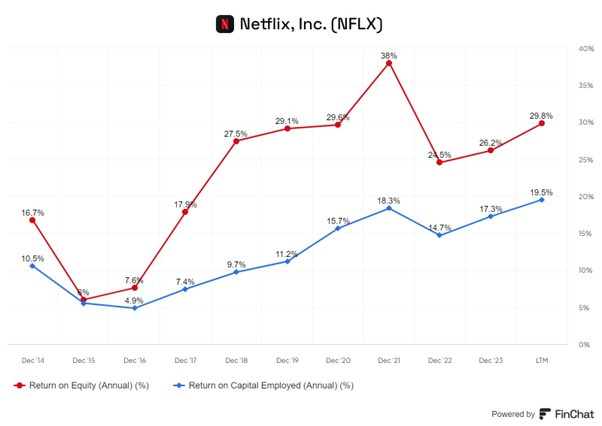
Chart 8: NFLX ROE (%) and ROCE (%) 2014- 2023
Profitability is also high with the Return on Equity (ROE) at 29.8% and Return on Capital Employed (ROCE) at 19.5% .
Chart 9: NFLX Operating Cash and Free Cash Flow 2014- 2023
The company has only generated cash since 2020 and 2023 was the first year of significant cash flow generation.
With the strong free cash flow, the company has been able to reduce net debt issuance. It now has investment debt rating as its financial profile has improved significantly, in the view of the debt rating agencies.
The high free cash flow now being generated will allow the company to finance programme production, reduce long-term debt (gradually) and buy back shares.
Chart 10: NFLX Repurchases of Common Stock 2021-2023.
The chart above shows share repurchases in the last three years. They are shown as negative as they involve a cash outflow. About $ 6bn worth of stock was bought back in 2023.
Chart 11: NFLX No of shares outstanding
The numbers of shares outstanding has started to fall due to the net repurchases of stock in the last three years.
Netflix’s debt spree looks like an astute investment. It borrowed some $15 billion to boost its market capitalization by more than $120 billion.
Chart 12: NFLX Share Prices
The share price has been volatile but since 1997 but over the long period investors have seen CAGR return of 29.6% per annum.
The market had got used to see high net addition to subscriptions every quarter. However in 2022, NFLX reported two straight quarters of subscriber declines and the stock declined 51% in 2022 as subscriber growth stalled (See chart above)
At the time the company explained it as follows:
“Our revenue growth has slowed considerably as our results and forecast below show. Streaming is winning over linear, as we predicted, and Netflix titles are very popular globally. However, our relatively high household penetration - when including the large number of households sharing accounts - combined with competition, is creating revenue growth headwinds.”
Chart13: Netflix Subscriptions Net Adds 2014-2021
The chart above shows the slowdown in net quarterly adds in 2020/2021 and the chart below shows the subsequent partial recovery.
Chart14: Netflix Subscriptions Net Adds 2022-2024
As we will see later, the company responded to this slowdown with the addition of a lower-priced advertising supported services and a crackdown of unpaid shared accounts. Revenues recovered somewhat in 2023 and the stock has recovered sharply.
NFLX ; Key Senior Management
Reed Hastings co-founded Netflix in 1997 and was the CEO for 25 years. He became the Executive Chairman in 2023. In 1991, Reed founded Pure Software, which made tools for software developers. After a 1995 IPO, and several acquisitions, Pure was acquired by Rational Software in 1997.
Ted Sarandos and Greg Peters are now co-CEOs of Netflix, after Reed Hastings became Executive Chairman.
Ted Sarandos was named co-CEO of Netflix in July 2020. He has been responsible for all content operations since 2000, and led the company's transition into original content production that began in 2013 with the launch of the series ‘House of Cards,’ ‘Arrested Development’ and ‘Orange Is the New Black’ among numerous others.
Greg Peters was named the co-CEO of Netflix in 2020. Before that Peters was the Chief Operating Officer and Chief Product Officer. Peters joined Netflix in 2008 from TiVo, and drove Netflix’s partnership strategy in the consumer electronics space and other go-to-market channels.
The Geography of the Subscriber Base
Chart 15: Geographical breakdown of NFLX Subscriber base
There has been a geographical diversification in revenues in the last five years. In 2019, USA and Canada (UCAN) accounted for about 65% of total revenues. Despite strong overall growth, UCAN now accounts for just below 50% of total revenue.
NFLX is leaning more on international markets, as its home market of North America is largely saturated. NFLX has relied on Europe and Latin America to supply most of its new customers in the last few years and has seen notable progress in Asia in the last two years. More than 60% of its customers now live outside the U.S. and Canada, and 83% of its new additions in last two years came from abroad.
One reason for this international growth is the creation of programmes which appeal to viewers globally. Netflix released popular series in many languages including German, Korean, Japanese, French and various Indian languages. Squid Game was a very successful breakout production in Korea. Squid Game cost $20mn to make but is stated to have “earned” $ 900mn.
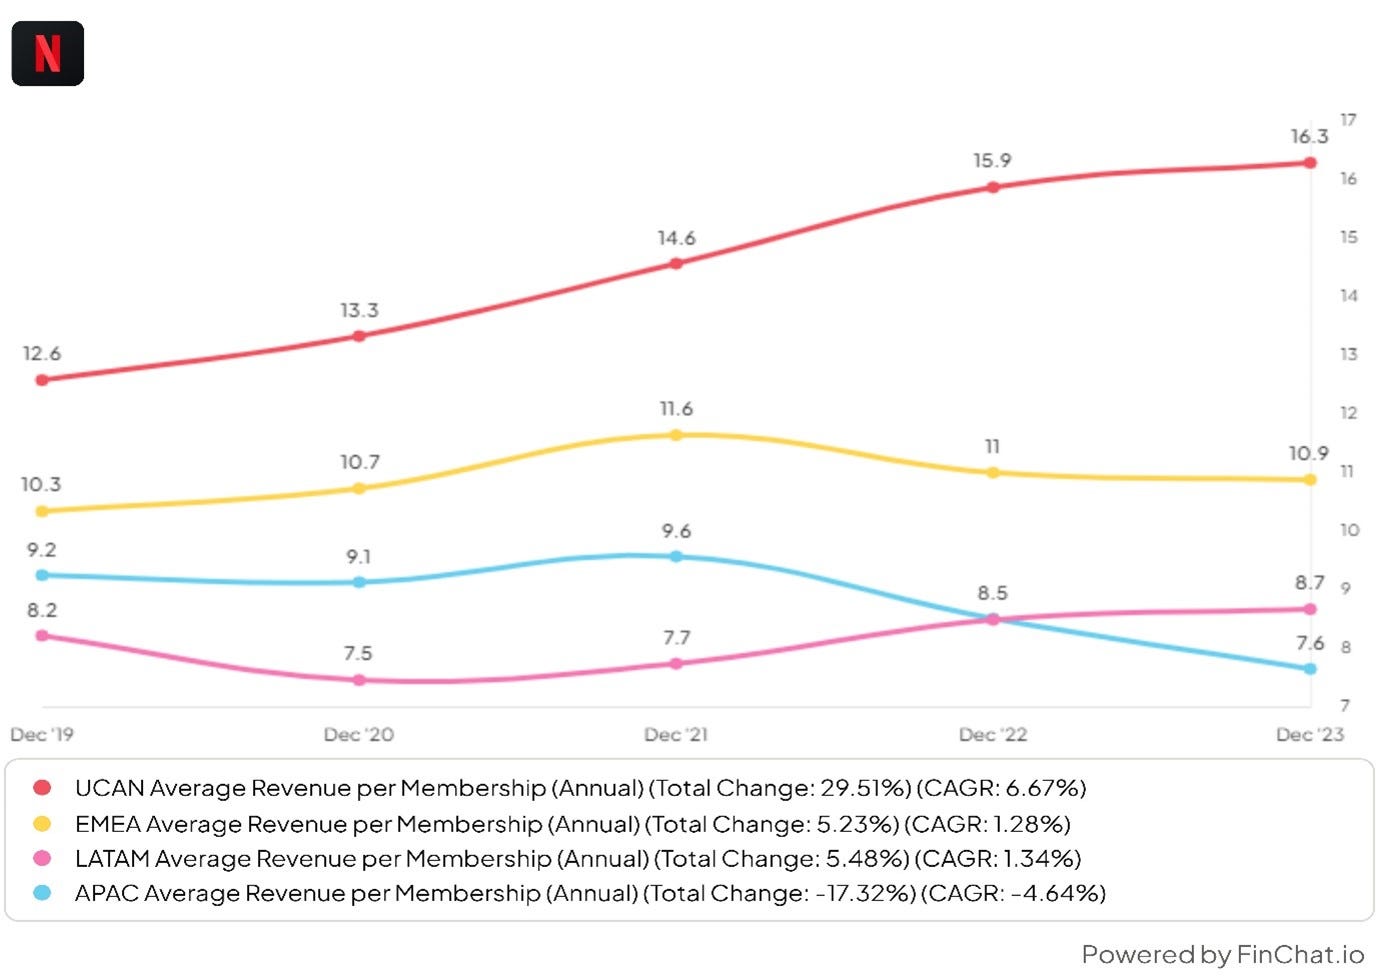
Chart 16: NFLX: Geographical breakdown of Average Revenue per Member (ARM)
The ARM tends to be highest in UCAN and lowest in LATAM and Asia. The latter are the fastest membership growing areas for NFLX and this can reasonably be expected to continue. However, due to lower ARM, the impact of growth in membership on revenue growth will be less, than was the case two years ago.
Attracting paying members is half the battle. NFLX and the other streaming companies need to retain them and endeavour to reduce the churn data. NLFX needs customers to say for a long time to see a strong long-term cash flow growth.
It is likely that viewers in Asia and Latin America are more price sensitive than those in UCAN and EMEA. As NFLX grows faster in the first two regions, it is likely that average churn rates will rise.
Netflix Market Share
How big is the total addressable market and what share does NFLX have?
This is a difficult question to answer. We will look at the UCAN market first and later consider the global market.
The chart below indicates that Streaming is about 30% of total US TV time and Netflix has a 6.8% share.
Chart 17: Market share of US TV Streaming market.
The fact that membership growth is UCAN is slowing suggests that Market is getting saturated and future growth will be more difficult to achieve. The company still believes growth is possible.
“…in the U.S. we're about 8% of TV time still. So, it's an enormous amount of growth ahead, even in markets where we are very well established.”
The market is well contested, and Netflix is faces competition from many sources. These include Max from Warner Bros Discovery (WBD), Paramount+ from Paramount Global (PARA) and Peacock from NBC Universal, which is owned by Comcast (CMCSA).
In the streaming space, competitors include Amazon Prime Video (AMZN), Apple TV+ from Apple (AAPL) and Disney+ and Hulu from Disney (DIS). YouTube from Alphabet (GOOGL) is another competitor for viewer attention and has been boosted by the growth of Google connected TVs.
Chart 18: Subscriber growth for US Streaming companies
Netflix has the largest number of subscribers and Disney + has grown strongly since its launch in 2019. Disney+ is a late entrant into streaming but is likely to prove to be a formidable competitor give the quality of its IP Brands (Disney Brands, Marvel, Pixar, Star Wars, National Geographic etc). The chart above shows the strong growth they have achieved since launching in 2020). HBO and Hulu have both seen sluggish subscriber growth.
Chart 19: Streaming companies’ Run Rate Streaming Revenues
YouTube, Hulu, and others as well as legacy DTH and Cable players remain formidable competitors. There may be a limited budget that households have for cable TV and consumers may have to choose between, for example, Disney, Apple TV. and Netflix.
Competition is likely to be fierce in the UCAN market but Netflix as a large player, which is already profitable and cash generating, is likely to be one of the survivors and eventual winners.
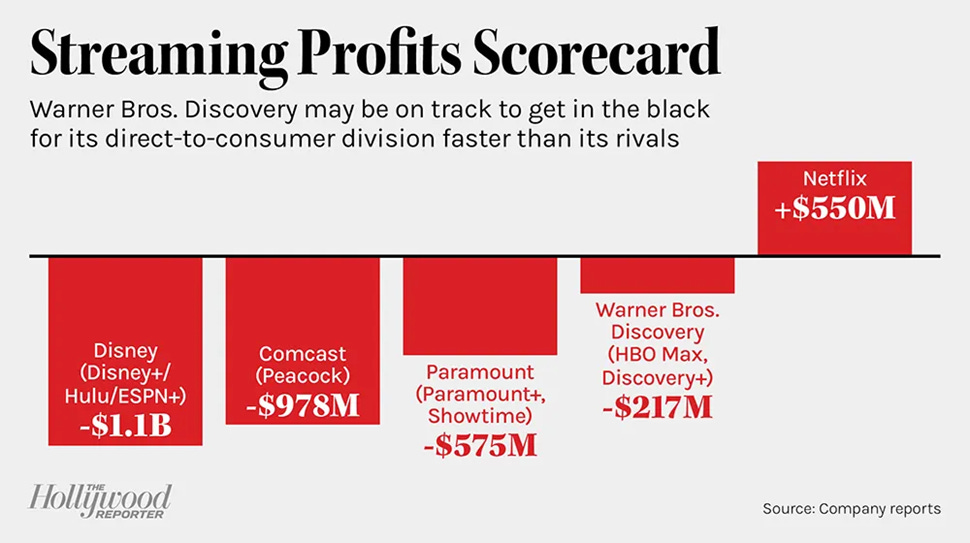
Chart 20: Streaming Companies’ Profit levels
As of 2023, NFLX was the only profitable streaming player in the USA. In 2024, Warner Brothers Discovery is likely to swing into profitability, but the others are likely to remain loss making. The challenges faced by their rivals are greater than those facing Netflix.
Global Market
Subscriber growth outside the USA is growing strongly but as noted above, non-UCAN ARM tends to be lower than UCAN ARM.
In non-UCAN markets, Competition comes mainly from YouTube, Amazon Prime, Disney+ and local and regional subscription channels. Apple + TV and Paramount are likely to increase their focus on non-UCAN markets.
There are estimated to be 900mn broadband connected devices globally (ex-China) and Netflix believe they have only captured 20%-30% of the market. This suggests that there is significant scope for further growth from the current membership tally of about 260mn, or 650mn viewers assuming 2.5 viewers per household.
“there's 800 million to 900 million broadband and /or pay TV households around the world outside China… We don't see why we can't be in all or most of those homes over time if we do our job.”
“The world is shifting from linear to streaming even in the largest markets - there is no country, where streaming is more than 40% of share of TV time, and in many big countries as you saw, it's less than 5%.”
“there's an incredible runway still in the shift from linear to streaming. And so, for us, it's about growing into that shift.”
The company believes they have differentiated themselves from other players.
“we don't really think about the pricing question from a competitive perspective. Again, we think of ourselves as a non-substitutable good, when you -- we think about Wednesday or you think about Glass Onion, these are titles you can only see on Netflix, that's extremely powerful.”
The medium-term market for NFLX is the world ex-China and ex-Africa. Let us assume that the number of broadband/pay TV households is likely to increase gradually and peak at around 1.0bn to 1.2bn.
If 40% to 50 % of these households buy Netflix memberships, Netflix memberships can grow to 500mn in the long run. ARM will decline, and therefore, revenue growth will be less than subscription growth.
As a broad guess, NFLX revenues, profits and cashflows by about 50%-80% from current levels in the long-run.
Two Recent Initiatives
NFLX has two current initiatives to boost revenues especially in UCAN. These are:
Account sharing monetization.
Implementation of ad-supported model.
When NFLX was building up its subscriber base and original programming capacity, it was relatively unconcerned about password sharing. One view was that if people are watching you using someone’s else password, at least they are not watching your competitors (!). In the last two years, the company has implemented a gradual strategy for reducing password sharing.
For example, it is allowing subscribers to add out-of-the-home family members at an additional cost. Subscribers on the most expensive plan at $19.99 a month can add two extra members for $ 8 in the US or GBP 5 in the UK. Those users get to keep their preferences and viewing history. Standard subscribers, at $15.49 a month, are limited to one extra member.
Netflix estimates that ~100mn households worldwide engage in password sharing, including ~30mn MM in UCAN. One brokerage survey in the USA two years ago indicated that ~53% of password sharing respondents would effectively pay for NFLX to maintain access to the streaming service.
If 50mn people started paying an additional $ 8- per year, this would add $ 4bn to the annual revenue run rate. Analysts have adjusted their numbers for the next two years to take account of this additional revenue.
Implementation of the ad-supported model,
Netflix has always emphasised that it is an advertising-free alternative to cable TV. However, in a major change they have added a lower price subscription model which includes advertisements. In the UK, the ad supported tier subscription fee is GBP 5 a month while the existing Standard and Premium add free options are GBP11 and GBP 18 per month respectively.
“I’d say that there was a strong legacy of an anti-ads position in the company that we were working through and I’m not sure it was a moment of desperation, but once we realized that there was a real opportunity there, and this was coming off of a period in time where the business had accelerated very, very rapidly through COVID and then we went into a period of much slower growth and we’re trying to figure out, “Okay, there’s a bunch of things we need to do to get back onto the path that we want to be on, and ads is one of them.” And as soon as we did that, it was like, “Let’s go super quick.” That urgency and that sort of fire — I was connecting back to your point about, “Let’s not waste the crisis” and we went from basically zero, we never do ads to we had launched this thing in six months.” Greg Peters
Netflix has raised prices several times and is now one of the most expensive streaming services. The move to ads is an admission that subscriptions have been raised too much and NFLX are meeting serious consumer resistance at least in UCAN. The evidence can be seen in the rise of the customer cancellations and slowing subscriber growth.
The ad supported option could also appeal to existing customers. This type of switching or downgrading would be negative for revenues.
NFLX has teamed up with Microsoft Corp where the latter will handle ad sales and associated technology infrastructure.
"We're not adding ads to Netflix as you know it today. We're adding an ad tier for folks who say 'hey, I want a lower price and I'll watch ads',"
Advertising can be a catalyst for renewed subscriber growth while having a neutral to positive impact on revenue per member. The advertising revenue per member will most likely offset the lower subscriber charge on the ad-supported tier.
Wedbush Securities has estimated that an ad-supported model could generate as much as $10 per month per subscriber in ad revenues.
"On balance, we think ad-supported subscriptions is a good idea, particularly as a disincentive to churn."
HBO Max (WBD), HULU and Disney+ (DIS) all have ad-supported tiers. Hulu, owned by Disney, has been running ads since 2007. The service reached nearly half of all connected TV households in the U.S. last year.
“ (The) advertising platform has been open only two months we were able to launch this very, very quickly and the tech is all working, the product experience is good. And that's really a testament to lots of hard work for both Microsoft and Netflix teams, who worked very hard to make that happen, and it's really rewarding to that to see.”
“we see that engagement from ads plans users is comparable to sort of similar users on our non-ad plans. So, that's really a promising indication, it means we're delivering a solid experience and it's better than we modelled.”
The ad-tier might be bringing in more new customers rather than switchers.
“We aren't seeing as expected much switching from high ARM, subscription plans like premium into our ads plans so the unit economics remain very good as we model.”
“we are competing mostly with that sort of traditional TV advertising pool not the digital advertising pool of Google /Meta.”
The dual measures are needed to reaccelerate growth given that Netflix is now on a flatter part of the demand curve in most Western markets.
The analysts believe it will help to grow revenues. Analysts’ consensus estimates for annual revenues are shown below:
The current share price reflects the expected better performance.
From 2010 to about 2020, the company’s priority was to spend as quickly as possible – on operations, content, etc. – to try and capture the huge opportunity presented from a rapidly expanding SVOD user base. Now that growth has slowed, the company is taking a step back to reassess and determine the best path forward.
Its competitors, legacy media companies and as streamers, all face similar challenges, and many of them are in a weaker position than Netflix.
NFLX has addressed post-Covid revenue growth challenges by
· Cracking down on password sharing
· Introducing ad-driven subscriptions
· Aggressively pushing subscriber growth in Latin America and Asia.
It is too early to see the impact of these measure but, they should be positive.
Other revenue generating initiatives
Netflix are moving into broadcasting live events and adding mobile video games.
In January 2023, NFLX announced a10-year deal worth $5bn to carry the WWE's flagship pro wrestling program "Raw" starting in January 2025.
In November 2021 NFLX added mobile games. Subscribers can play games on Android and Apple iOS smartphones and tablets. Since 2021, Netflix has purchased four game studios and has opened two new studios. It currently offers more than 90 games to subscribers. They include action, arcade, puzzle, racing, sports and casino games.
Improved Cash Generation
The cash generation profile of NFLX look a lot stronger than before. The company has reached the kind of scale and position that it will be a major generator of Free Cash Flow (FCF) in the next few years.
Netflix's plans to cap annual content spending to around $ 17bn means free cash flow (FCF) will be maintained at the $ 7bn level seen in 2023. This would allow annual share buybacks of at least $5 billion.
Latest Quarterly Results.
Netflix announced its first quarter results on April 18, 2024. The stock fell 9.1% on the first trading day as the company’s sales forecasts where less than expected. Analysts were also concerned about the announcement that NFLX will stop releasing quarterly sales numbers next year.
Q1 Total Revenue grew 6.1% (q/q) and 14.8% ( y/y) . The numbers also indicate the operating leverage NFLX enjoys. Over the last three years, Revenues have grown at a CAGR of 17.6% while Operating Profit and Net Profit have grown at a CAGR of 40% and 49% respectively.
UCAN and EMEA revenue grew more than the average (17.0% and 17.5% (y/y)) while LATAM and APAC grew less than average ( 8.9% and 9.5% (y/y) respectively.
UCAN and EMEA revenues have probably been boosted by subscriber growth and the impact of the end of password sharing and the introduction of ad-supported tiers. LATAM and APC revenue growth has been constrained by the lower ARM in those geographies.
Margins have recovered strongly.
In the March quarter, Netflix earned $5.28 a share on sales of $9.37bn. Analysts had modelled earnings of $4.52 a share on sales of $9.28bn.
For the current quarter, Netflix forecast earnings of $4.68 a share on sales of $9.49bn, The sales number was slightly less than analysts’ expectations. Wall Street was looking for earnings of $4.54 a share on sales of $9.52 billion in the second quarter.
NFLX says it will stop reporting subscriber additions and average revenue per member from 2025, sowing doubts in investor minds about growth peaking in some markets. This was an unexpected and negative move. It probably reflects that subscriber growth in new growing markets may not lead to as much revenue growth as before.
Highlights from latest earnings call
They were asked about the decision to stop reporting subscriber numbers from 2025.
“We're going to continue to evolve developing our revenue model and adding things like advertising and our extra member features, things that aren't directly connected to a number of members.
We've also evolved our pricing and plans with multiple tiers, different price points across different countries. I think those price points are going to become increasingly different. So each incremental member has a different business impact.
And all of that means that historical simple math that we all did, number of members times the monthly price is increasingly less accurate in capturing the state of the business.”
This change is really motivated by wanting to focus on what we see are the key metrics that we think matter most to the business. So we're going to report and guide on revenue, on OI, OI margin, net income, EPS, free cash flow. We'll add a new annual guidance on our revenue range to give you a little bit more of a long-term view.
We'll also - we're not going to be silent on members as well. We'll periodically update when we grow and we hit certain major milestones, we'll announce those. It's just not going to be part of our regular reporting.
On the recent boost to revenue boost to Revenue Growth.
“We've done a lot of hard work over the past 18 months or so to reaccelerate the business and reaccelerate revenue through combination of improving our core service, which Greg and Ted just talked about and rolling out paid sharing, launching our ads business and that reacceleration really started in the back half of '23 and it built through the year.”
On future growth prospects
“We're only 6% roughly of our revenue opportunity. We're lesser than 10% of TV share in every country in which we operate. There's still hundreds of millions of homes that are not Netflix members and we're just getting started on advertising.”
“We are seeing some ARM growth as well. We saw it in Q1, about 1% on a reported basis, 4% FX-neutral. And what's - I just want to be clear, what's happening is that with ARM is price changes are going well. And that's why we're seeing those strong acquisition retention trends because it's testament to the strength of our slate, the overall improvement in the value of our service. But we've only really changed prices in a few big markets and that was U.S., U.K., France late last yea
We also have some ARM kind of headwinds in the near-term that you see in Q1. So while it's highly revenue accretive, as you can see in our numbers and our reported growth - strong reported growth in Q1 and outlook for the year, that growth - as we spin-off into new paid memberships, they tend to spin-off into a mix of planned tiers that's a little bit of a lower-price view than what we see in our tenured members.”
And we're also growing our ads tier at a nice clip as you've seen.
Forecasting a step up in Operating Margins
Our focus is on sustaining healthy revenue growth and growing margins each year. That's what we talk about a lot of we also talked about in the letter. And we feel good about what we've been delivering, 21% margins last year, that's up from 18% in the year before. And now, we're targeting 25% this year, which is up a tick from the start of year when we were guiding to 24%.
..we're committed to grow margin each year. And we see a lot of runway to continue to grow profit and profit margin over the long term.
So we're 65% up quarter-to-quarter this last quarter. That's after two quarters of about 70% quarter-over-quarter growth. For me, it's exciting to see that growth rate stay high even as we've grown the base so much”
The ads business
We've got more to do in terms of effective go-to-market, more technical features, more ads products.
in the long term is that it would be healthy for us to land overall monetization between our ads and non-ads offerings in roughly an equivalent position. So it really comes down to what works best for any given member.
we've been growing our inventory (of ads) at quite a fast clip. And so, monetization hasn't fully kept up with that growth in scale and inventory as we're still early in building out our sales capabilities and our ad products. But that is an opportunity for us, because we're still a very premium content environment, a very highly engaged audience that's at an increasing scale.”
On the Capital Allocation Strategy.
“(We have the) same financial policies and principles in terms of prioritizing profitable growth by reinvesting in our core business, maintaining a healthy balance sheet with ample liquidity and returning excess cash beyond several billion dollars on the balance sheet of minimum cash and anything that we use for selective M&A to return to shareholders through share repurchase.
we've been focused on driving that acceleration of our revenue growth, continuing to grow our business, grow our profitability. As we do that, we would expect to continue to grow our content investment as we have historically into the highest impact areas, but also be quite disciplined there.
So we want to grow our free cash flow. So we believe we can manage to that roughly 1.1 times of cash content spend relative to expense on the P&L and that leads to overall revenue growth, increased profit, profit margins, growing free cash flow. And that still gives us a lot of opportunity to spend into all those kind of content and entertainment categories that Greg and Ted have been talking about.”
On AI and Machine Learning
“we've been leveraging advanced technologies like ML for almost two decades. These technologies are the foundation for our recommendation systems that help us find these largest audiences for our titles and deliver the most satisfaction for our members.
We will continue to involve and improve those systems as new technologies emerge and are developed.
We also think that we have the opportunity to develop and deliver new tools to creators to allow them to tell their stories in even more compelling ways.”
Summary
Since 1997, Netflix has grown to become one of the largest home entertainment broadcasting companies.
Between 2014 it borrowed heavily to produce original content on such a scale that it scared Hollywood. Content production was in various diverse geographies, cultures, and languages.
The investment in content helped to grow a large paid subscriber base, which currently stands at 290mn.
Faced with a post-Covid slowdown in subscriber and revenues growth, the company responded by ending password sharing and introduced ad-supported tier.
The debt binge, investment in content and rapid growth has greatly strengthened the company and significantly de-risked it as an investment.
Despite growing competition esp. from players like WBD’s HBO Max and Disney+ . NFLX has established as the dominant platform in the new evolving broadcast media landscape. It is the market leader.
The company is now generating strong cash flow, which is enough to fund production, payback debt and buy back stock.
The company is likely to generate a minimum FCF Cash Flow of $ 7bn per annum and this is likely to reach $ 9bn to $10bn in 5 years.
Valuation
At the current price of $ 564 per share, the company is trading on a two-year forward P/E Multiple of 25X.
The shares are trading on a Forward Price to FCF ratio of 28X.
This implies Forward Earnings Yields and Free Cash Flow Yields of 4% and ~ 3% respectively.
The company is likely to generate an ROE of 30% and ROCE of 20% over the next few years.
Given these prospective returns, current valuations look reasonable. However, it is hard to argue the stock is cheap.
Conclusions
The stock looks attractive as a long-term hold. We will continue to monitor it closely.


