

Some Financial Metrics Return on Invested Capital (ROIC)

Some Financial Metrics
Return on Invested Capital (ROIC)
In previous posts of this type, we have looked at Free Cash Flow (“FCF”), Return on Equity (“ROE”) and Return on Capital Employed (“ROCE”).
In this one we look at Return on Invested Capital (ROIC) which is another important profitability metric.
Suppose that there are 2 companies:
Company A: It has a ROIC of 10% and reinvests all its profits for 25 years
Company B: ROIC of 25% and reinvests all its profits for 25 years
Can you guess how much company A and B would be worth if one invests invest USD 100 in both
In this example, an investment in company A would be worth USD 1083.5 while an investment in company B would increase to USD $26,469. This is a big difference and shows that, other things being equal, ROIC is an important driver of long-term value of a company.
What is Return on Invested Capital (ROIC)?
.
Return on Invested Capital (ROIC) = (NOPAT / Invested Capital)
NOPAT = Net Operating Profit After Tax
Invested Capital = Total assets - non-interest-bearing current liabilities
When a company has a ROIC of 25%, it means that for every USD 1,000 in capital the company has on its balance sheet, USD 250 in NOPAT is generated every year.
Why ROIC matters
In this example, we have 2 companies: Moat Inc. and Payout Inc.
Both companies generate a NOPAT of USD 10 million per year and need USD 50 million to operate (invested capital). Both companies have a ROIC of 20%.
Payout Inc. has no growth opportunities and distributes all earnings as a dividend to shareholders. As a result, Payout will distribute USD 10 million to shareholders each year and will still make USD 10 million in profits 20 years from now.
Payout is like a fixed income bond; it distributes a fixed amount of money every year (think of it as a coupon) but there is no capital growth.
On the other hand, Moat Inc has lots of growth opportunities and is able reinvest all its earnings and put them to work earning the high ROIC. Moat Inc pays no dividend.
After 1 year, Moat Inc. has USD 60 million in capital (the starting capital of USD 50 million + USD 10 million in reinvestment). On this invested capital of USD 60 million Moat Inc. generates a ROIC of 20%. As a result, Moat Inc ’s earnings grew to USD 12 million (20% * USD 60 million).
If we re-arrange the previous ROIC equation as follows
NOPAT = ROIC * Invested Capital
This illustrates the virtuous circle for Moat Inc as its Invested capital grows at 20% every year and it subsequently earns 20% on its enlarged capital.
In year 2, Moat Inc. again reinvests its earnings of USD 12 million in organic growth. As a result, Moat Inc.’s invested capital grows to USD72 million. The earnings of Moat Inc. grow to USD 144 million (20% * USD72 million).
If MOAT Inc grows like this for 20 consecutive years it will be worth USD 380mn US$ 10mn * (1.2) ^20 = 380mn.
This does not mean that investing in a company like Payout Inc is necessarily a bad idea.
See’s Candies was a Payout-type company. Berkshire Hathaway Company bought it for USD 25mn in 1972 when it had a pre-tax profit of USD4mn. It did not need much re-investment and the bulk of the fast-growing profits were up streamed to Berkshire Hathaway. Over the years, it has generated over USD 1bn in cash for Berkshire which has been successfully re-invested. Warren Buffet called See’s “the prototype of a dream business”.
In this case, investing in a Payout Inc type business proved to a phenomenally successful decision.
However, it only worked so well because
a. the payments from See’s to Berkshire did not attract a dividend tax (it was an inter-company transfer).
b. Berkshire Hathaway was able to re-invest the money in some attractive opportunities
In most cases, the dividends from a company like Payout Inc would attract a dividend tax and most investors would not be confident about their ability to re-allocate the capital successfully. Ordinarily, an investor would be better off investing in a Moat Inc type company rather than a Payout Inc type of company.
A high ROIC in combination with plenty of growth opportunities is often the sweet spot for investors. It will result in exponentially increasing earnings for a company if management makes good capital allocation decisions. There is one very important caveat to this happy conclusion.
Growth only creates value when the Return on Invested Capital (ROIC) of a company is higher than the Weighted Average Cost of Capital (WACC).
If this is not the case, and ROIC is less than WACC, growth is destroying value. Such profitless growth is worse than no growth.
WACC is the firm’s average cost of capital (cost of equity + cost of debt).
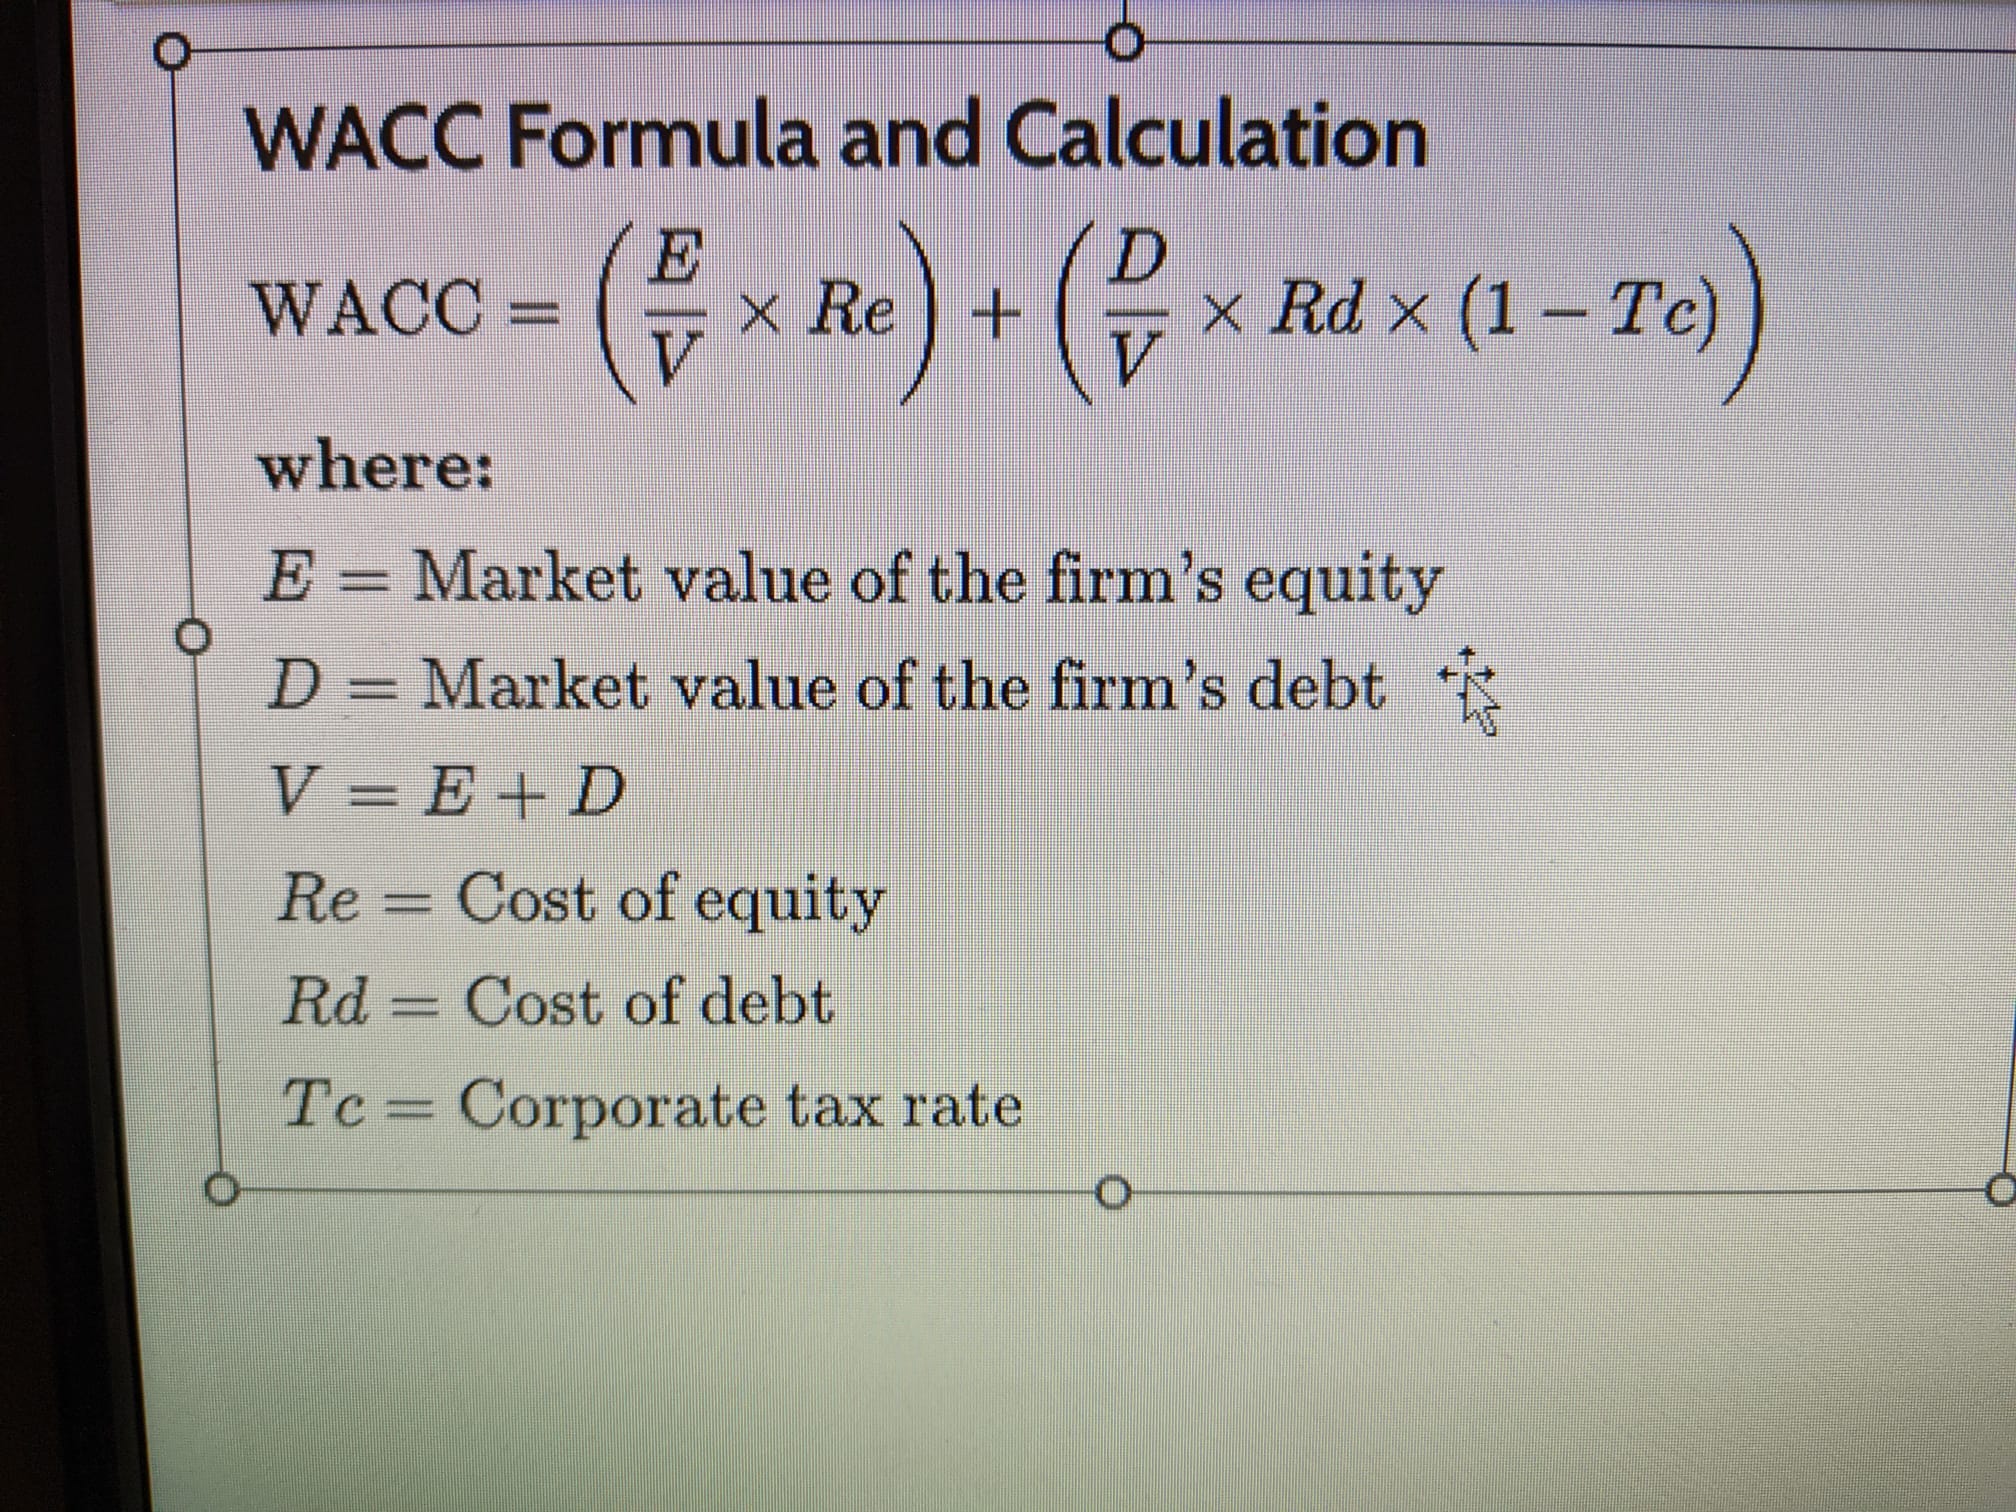
Source: Investopedia
It is logical to expect the percentage return the company earns on its investments (ROIC) should be higher than the company’s cost of finance for these investments (WACC).
Let’s give another example to clarify this:
Company A has a ROIC of 5% and a WACC of 10%. The company’s NOPAT is equal to USD 10 million, and they are offered a new project which will generate USD1 million in NOPAT.
When company A would accept this project, they will need USD 20 million in capital to execute this project (USD1 million / 5%).
ROIC = NOPAT / Invested Capital
Invested Capital = NOPAT/ROIC
Company A has a WACC of 10% and as a result they will need to pay USD2 million (USD 20 million *10%) to finance this project.
Cost of capital = Capital needed * WACC
As a result, company A should pay USD2 million to finance the project while it will only generate USD 1 million in NOPAT. Company A shouldn’t accept this project because they would lose money on it.
On the other hand, Company B has a ROIC of 20% and a WACC of 10%. The company’s NOPAT is also equal to USD10 million, and they are offered the identical project as company A which would generate USD 1 million in NOPAT.
When company B would accept this project, they will need USD 5 million in capital to execute this project (USD1 million / 20%).
Company B has a WACC of 10% and as a result they will need to pay USD 500kn (USD5 million *10%) to shareholders and debtors to finance the project.
Company B should pay USD 0.5 million to finance the project while it would generate $1 million in extra NOPAT. Company B should accept this project.
The difference between ROIC and WACC is also known as the Economic Value Added (EVA) rate.
If ROIC = WACC, EVA will be Zero
If ROIC =12% and WACC is 10%, EVA is 200 basis points.
Other things being equal, the higher the EVA, the better an investment in the company is likely to be.
Reinvestment needs
When you want to calculate how much a company should reinvest to achieve a certain rate of growth, you can use this formula:
Reinvestment need = (desired growth / ROIC)
Let’s say that a company has a ROIC of 20% and wants to grow its NOPAT with 10% per year.
In that case, the company should reinvest 50% of its NOPAT (10%/20%) to grow with 10% next year.
A high ROIC is interesting because it results in lower reinvestment needs for the company. The best companies in the world can grow attractively (> 10% per year) while reinvestment needs are very low to achieve this growth. For modern Value investors, the company which can grow for long period at high rates of return without significant re-investment needs is like the Holy Grail, very rare but extremely valuable.
When a company needs to reinvest less, they can use their cash flow for other things like paying dividends and buying back shares.
ROIC, like ROE, can be seen as a proxy for a moat
A consistent and high ROIC is an indication that the company potentially has a sustainable competitive advantage.
A high and consistent ROIC is likely to be the result of a sustainable competitive advantage. Otherwise, the entry of competition would have reduced the ROIC.
Conclusion
ROIC is an important financial metrics for quality investors as it indicates how efficiently management is allocating capital.
One wants to invest in companies with a high and consistent ROIC which is also is higher than its WACC.
These stocks are likely to have a high and consistent ROIC with plenty of reinvestment opportunities. This will allow the company to grow its free cash flow exponentially.