

US Large-Cap Banks
2021 Q4 and Full Year Results and Conference Calls with Management

Markets: US Equities
Theme: Fourth quarter Financial Results from the Large Cap Banks
Companies discussed: JP Morgan (JPM), Morgan Stanley (MS), Citibank (C), Bank of America (BAC) and Goldman Sachs (GS)
We are now right in the middle of the fourth quarter reporting season for US stocks. The early part of the reporting season is dominated by large cap financials.
We have analysed and considered the results reported for the above institutions and listened to all the post-results Conference Calls with Management.
Key points
The companies reported very strong numbers for the full year (2021) but many noted a decline in trading revenues in the last quarter. This creates worries about cyclicality of trading revenues
M&A activity and Investment Banking more broadly had a record year and companies report strong pipelines into 2022
Strong markets and healthy inflows boosted AUM and Client assets at Asset Management Divisions and Wealth Management/ Private Banking division.
There is concern about the sharp increase in compensation which led to concerns about whether trading banks business models have any real operating leverage. The risk is that banks are greatly raising compensation after a record year and pay will remain elevated at the new higher levels but profits will decline.
Banks noted huge ongoing investment in trading and systems. For what seems like decades, banks have been major investors in technology and key clients for consultants such as Accenture, IBM, and Infosys etc.
In Q1 2020, in anticipation of huge credit losses due to Covid19. Banks started releasing these in late 2020 and continued to do so in 2021. This has helped to boost headline numbers
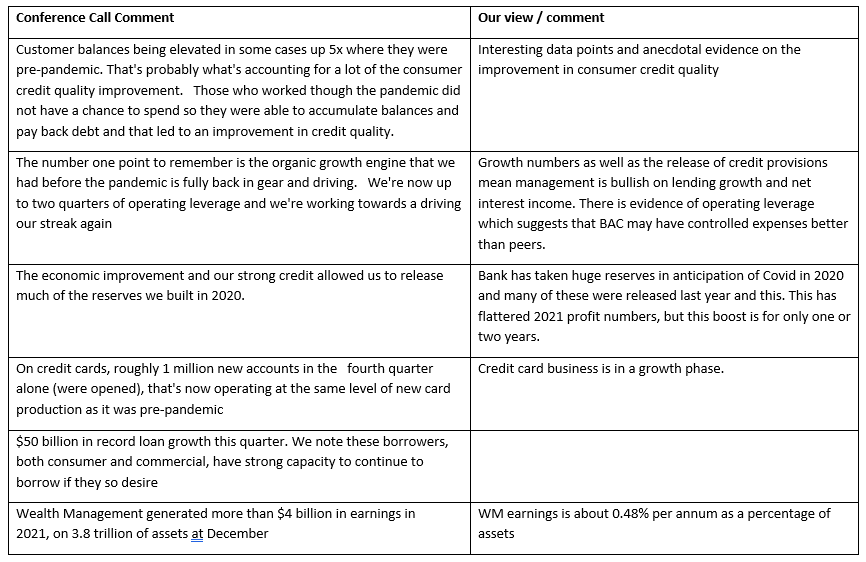
The pandemic has helped individual cash holding and improved credit card loss metrics and generally improved the credit quality of the personal sector.
For the large lending banks, there is a modest pickup in credit growth.
Banks are modelling the impact of the likely much higher interest rates on their net interest income and overall profits
Regulatory capital requirements are likely to rise as new Basle rules on capital required for counterparty risk and higher capital buffers for the largest systemic institutions come into view.

Key Financial data: Source Bloomberg and Stockopedia.
Market Capitalisation and Price to Book data as of 24 January 2022. Other data is end-December 2021.
The data on long term returns shows that it has been difficult for the sector to outperform the S&P 500 though the outperformance of Morgan Stanley in the last 10 years has been remarkable. Given the high level of leverage that deposit taking institutions (after the global financial crisis, securities firms got banking licenses to get direct access to Fed lending) can take, one would expect financial institutions to be able to outperform the index.
However, in practice, it is not so simple due to the minimum amount of capital required by regulators, the high-cost income ratios and, in recent years, the huge and ongoing investments, especially in technology.
JP Morgan (JPM)
The company’s reporting segments are given below:

Source: Company Reports
As can be seen above, JP Morgan has a huge and very profitable retail banking presence (built out of the combination of Chase Manhattan, Washington Mutual and Bank One after the financial crisis). Asset Management in JPM is relatively small contributor to revenue. CIB and CCB are roughly equal in size as they account of about 40% of revenue each.
Summary of the 2021 Q4 Results of JPM
Q4 Revenue was US$ 30.3bn (up 1% y-o-y) compared with consensus expectations of US $ 29.9bn (a slight beat).
Q4 Net Profit was US$ 10.4bn (down 14% y-o-y) due to higher non-interest expense (compensation and technology investment) and weaker performance by the trading business. US$ 1.4bn worth of credit reserves were released back and without this Q4 Quarterly income would have been close to US$ 9.4bn.
Q4 Markets revenue (within CIB) fell 11% y-o-y (FICC was down 16% while equities was down 2%) reflecting the difficult trading conditions
Summary of the full year 2021 results of JPM
Full year revenue was US$ 125.3bn revenues was a record high and up 2.4% (y-o-y).
Full year net income was US 48.3bn was a record and up 38.5% (y-o-y).
Return on Average Tangible Common Shareholders Equity (ROTCE) was 23.9 % for the year a whole but only 15.6 % in Q4. A key indication of the deterioration of trading conditions in the last quarter of 2021.
So, in summary 2021 was record year for revenues, profits and profitability. However, trading conditions deteriorated greatly in the fourth quarter due to difficulties in FICC and Equities markets to cause poor Q4 Results.
These difficult conditions are likely to continue in 2022 where the strong H1 2021 numbers will prove to be difficult comparatives but as a major lender, JPM will benefit from the growth in lending
JPM Conference Call highlights

Morgan Stanley (MS)
The company’s reporting segments are given below :
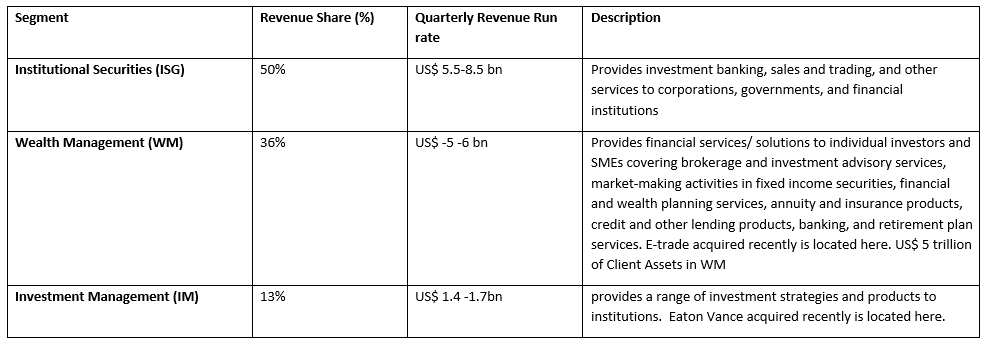
Source: Company Reports
MS has had a decade long plan to diversify earnings away from the volatile Institutional Securities Group (ISG) business. In Q4 2021 IS business did well and accounted for 50% of revenues. WM accounted for 36%. However, trading conditions are unlikely to be as favourable going forward and MS’s aim of having both ISG and WM contribute about 40%-45% of revenues seems to have been achieved. As is the case with JPM, Investment Management is a relatively small business at MS.
Summary of the 2021 Q4 Results of MS
Q4 Revenue was US$ 14.5bn (up 7% y-o-y) which just fell a little short of expectations.
Q4 Net Profit was US$ 3.7bn (up 9% y-o-y) which was higher than expectations
Q4 ISG revenue fell 4.8% y-o-y reflecting the difficult trading conditions in global markets. Within that, Fixed-income was down 15% y-o-y.
Q4 WM revenues grew 10% y-o-y
Q4 IM revenues grew 8% y-o-y
Summary of the full year 2021 results of MS
Full year revenue was US$ 59.8bn revenues, a record high and up 24% (y-o-y). This was boosted by the inclusion of the Eaton Vance acquisition (which brought in AUM of 1.6 trillion) which closed last March
Full year net income was US 14.9bn was a record and up 25% (y-o-y).
Return on Average Tangible Common Shareholders Equity (ROTCE) was 20% for the full year. Pre-tax Margin was 39.6% up from 34.6% in the previous year.
So, in summary 2021 was record year for revenues, profits and profitability. However, trading conditions deteriorated greatly at the end of the year due to difficulties in FICC and Equities markets and led to poor Q4 Results.
These difficult market conditions are likely to continue in 2022 where the strong H1 2021 numbers will prove to be difficult comparatives.
MS Conference Call highlights:

Citigroup Inc (C)
The company’s reporting segments are given below:

Source: Company Reports
As the data of returns above shows, Citigroup has underperformed their peers. They are currently trading at a Price to Book ratio of 0.68 times (well below book value) compared with 1.65 for JPM and 1.47 for BAC which indicates that the markets do not believe that Citi is going to change from being a laggard to a leader anytime soon.
Citigroup is embarking on a process of radical change which will transform the structure of their business. They are in the process of getting out of the global retail consumer banking network. They announced a withdrawal out of 13 Asia/ EMEA markets last year and are looking at exiting from Mexico which is one of their largest consumer /retail franchises. They bought Banamex in 2001 and are the second largest bank in Mexico. Once these changes are complete, their segments will look as follows.
· Institutional Clients Group (ICG)
· Personal Banking & Wealth Management- This includes Global Private Bank
· Legacy Businesses- residual Asia and Mexico consumer banking business as well as some remaining legacy holding assets. This segment will be wound down over time.
After the transformation is complete, the structure of Citigroup will look more like its peers, and this will make comparison easier
Summary of the 2021 Q4 Results of Citigroup
Q4 Revenue was US$ 17bn (up 3% y-o-y) and 3% above analysts’ expectations
Q4 Net Profit was US$ 2.9bn (down 25% y-o-y) Results were depressed by $1.1bn in expenses for ongoing divestitures of consumer banking businesses outside of the United States.
Q4 ROTCE was just 7.4%
Q4 ICG revenue rose 4%. Within that Fixed-income was down 20-% y-o-y but investment banking was up 43% (y-oy)
Q4 GCB revenues were US$ 6.9bn (down 6% y-o-y)
Summary of the full year 2021 results of Citigroup
Full year revenue was US$ 71.8bn revenues and down 5% on the previous year.
Full year profits were US$ 21bn and were much higher than 2020 as the bank had taken USD 17bn of credit provision due to Covid19 fears in 2020. This was not an issue in 2021 and US$ 3bn of these reserves were released in 2021.
Return on Average Tangible Common Shareholders Equity (ROTCE) was 13.4% for the full year
Market conditions deteriorated greatly in the fourth quarter and led to difficulties in FICC and Equities markets to cause poor Q4 Results.
These difficult market conditions are likely to continue in 2022 where the strong H1 2021 numbers will prove to be difficult comparatives. In additions there will be most cost relating to the ongoing divestures of global consumer banking businesses.
As a major lender, Citi will benefit from the growth in lending
Conference Call highlights:

Bank of America (BAC)
The company’s reporting segments are given below

Source: Company Reports
Summary of the 2021 Q4 Results of Bank of America
Q4 Revenue was US$ 22.1bn (up 9% y-o-y) and above analysts’ expectations of 22bn. This is equally split between net interest income and non-interest income.
Q4 Net Profit was US$ 7.07bn (up 27% y-o-y) beat analysts’ expectations
Q4 GB recorded US$ 5.9bn of earnings (up 25% y-o-y) and US$ 2.6bn of net income
Q4 GM recorded US$ 3.8bn of earnings and US$ 669mn of net income (down 20% y-o-y). FICC earnings fell 10% but equities rose 3%
Q4 CB recorded US$ 9bn of earnings (up 8% y-o-y) and US$ 3bn of net income
Q4 GWIM revenues were US$ 5.4bn and US$ 1.2bn of net income
Summary of the full year 2021 results of Bank of America
Full year revenue was US$ 89 bn revenues and up 4.1% on the previous year.
Full year profits were US$ 30.7bn and were very slightly higher than the previous year.
Return on Average Tangible Common Shareholders Equity (ROTCE) was 17.0% for the full year
Market conditions deteriorated greatly in the fourth quarter and led to difficulties in FICC where revenues fell 10% (y-o-y)
These difficult market conditions are likely to continue in 2022 where the strong H1 2021 numbers will prove to be difficult comparatives. However personal credit has improved in the quarter and retail customers have built up cash balances. Therefore, consumer credit numbers have improved greatly. Credit card issuance and retail lending is growing strongly, and this should give a boost to earnings to a large lender like BAC.
Conference Call highlights (BAC) :
Goldman Sachs (GS)
The company’s reporting segments are given below:
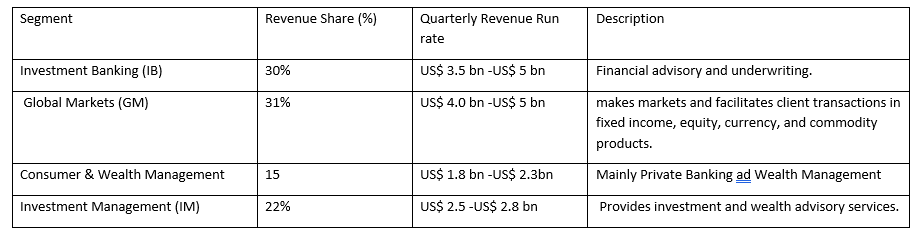
Source: Company Reports
Summary of the 2021 Q4 Results of Goldman Sachs
Q4 Revenue was US$ 12.6bn (up 8% y-o-y) and above analysts’ expectations of 12.13 bn
Q4 Net Profit was US$ 3.93bn (down 13% y-o-y)
Q4 EPS was US$ 10.81 compared with analyst expectations of US$ 11.81 (EPS Miss)
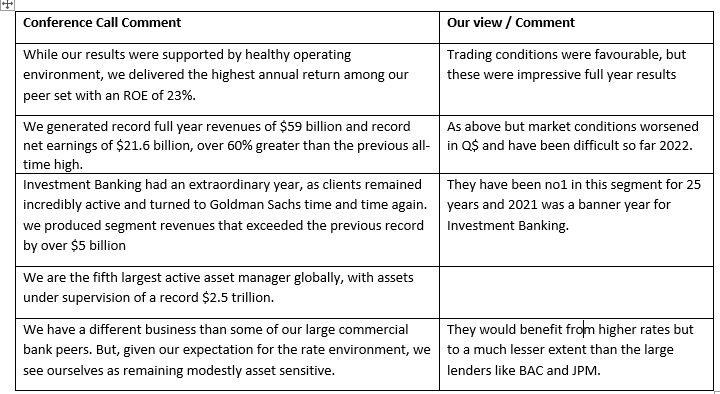
Q4 IB recorded US$ 3.8bn of earnings (up 45% y-o-y)
Q4 GM recorded US$ 3.8bn of earnings (down 7% y-o-y). FICC earnings fell 1% but equities rose 20%
Q4 IM recorded US$ 2.9bn of earnings (down 10% y-o-y)
Summary of the full year 2021 results of Goldman Sachs
Full year revenue was US$ 59bn revenues and up 33% on the previous year.
Full year profits were US$ 21.6bn (up 129% y-o-y).
Return on Average Tangible Common Shareholders Equity (ROTCE) was 24.3% for the full year
Conference Call highlights:
Conclusions
The banks have had a very strong 2021 and the 2021 full year results reflect this. Financial market conditions were bad in Q4 2021, and this can be seen in the Q4 numbers.
2022 will be a more challenging year for trading business especially as the 2021 comparatives will be challenging.
We have concerns about the sharp increase in compensation which led to concerns about whether trading banks business models have any real operating leverage. The risk is that banks are greatly raising compensation after a record year and pay will remain elevated at the new higher levels but profits will decline as the cycle turns.
In terms of the stocks, we have slight preference for MS and JPM.
C is on a low valuation, but it faces significant challenges as it seeks to divest several large businesses in its Global Retail/Consumer Bank Franchise.
It must prove that even after the transformation, it can deliver strong returns to shareholders in line with peers.
We are cautious on GS. The results are strong but too much of the rewards of higher profits and greater productivity seem to go to employees.
The historical returns for our group of stocks (noted above) cover the great financial crisis of 2008.09 when the whole sector suffered greatly. However, the numbers show that these stocks have not as a group beaten the returns on the S&P 500.
This raises the question whether an unconstrained investor should invest in the sector at all.
Terry Smith who manages US$ 29bn in assets has characteristically strong views on the subject. He does not invest in banks as he believes they are “black boxes”. Compared to other sectors, he believes we have little visibility on how banks (especially those with large and complex trading activities) make their money. Despite the ever higher regulatory capital demanded by regulators and even greater compliance and risk management resources, there is a always a risk of unacceptably high losses for shareholders due to trading losses.
On the other hand, Warren Buffett has large stakes in Bank of America and other banks . He has huge amounts of capital to deploy and perhaps cannot ignore this sector completely. In addition, he can take advantage of his position and periodic crisis situations to invest on very attractive terms.
My own view is closer to Smith rather than Buffett. This is an industry where the probability of very large losses is low but not low enough. In addition, too much of the profits accrue to employees but 100% of the losses fall on the providers of risk capital.
We do have small exposures to MS and JPM, but they are not the core of our portfolio.