
US Politics and Stock markets
DOGE, Federal Debt and Tariffs

We do not write about politics on this Substack
First, it is just words on a page or screen, and you rarely convince anybody to change their mind. However, you risk annoying at least 50% of their audience for no good reason.
Secondly, our time is limited. We find it is better to devote what time we can spare to fundamental bottom-up analysis of companies. This what we try to do.
In January, we felt that stocks were too expensive, valuations were too high and out portfolio was 30% in cash within two weeks.
We were too early by a month. Stocks continued to rise as they were optimistic about the economic consequences of a second Trump term. Markets have fallen significantly in the last six weeks and the indices have gone back to the levels of September 2024.
Valuations now are much more reasonable in many cases though markets can (and often do) overshoot on both the upside and the downside -stocks can go much lower.
However, it seems to us, the weakness now is driven as much by economic policy as by valuations. Markets seem to be driven by politics.
Therefore, we will, for once, break our rule, and talk about politics- specifically the economic policies of the US government.
The Trump administration, to their credit, has identified three important and related economic factors which need to be tackled urgently.
These are
The US government budget deficit.
The US trade deficit.
The high unsustainable level of US government debt.
Let us look at them in turn
The US government budget deficit.
The US Government has been spending more than its revenue since 1970. There has been a deficit in every single year except one (not sure what President Clinton did in 2000) since 1970.

There may be a good reason for the government to have a deficit in some years (e.g. - a recession. These are shown in grey in the chart above) but to have deficits in 54 of the last 55 years seems excessive.
The deficit was very high in 2021 during the Covid Pandemic and has improved a little since then but it is still about $ 2trn a year run rate.
These deficits must be financed, mainly by issuing government Treasury Bills and Bonds. These vary in maturity between three months and thirty years. The stock of debt increases every year when there is a deficit. As here has been a deficit in the last 54 out of the last 55 years and the Federal debt has grown very rapidly

As the chart above shows, total US government federal debt has increased from US$ 400bn in 1970 to about to US 36trn. This is annual CAGR growth 8.5% per annum over 55 years (!).
This is a huge rate of growth but what matters is the level relative to the size of the economy. We would not be worried if the debt is just increasing in line with or less than the growth of the economy.
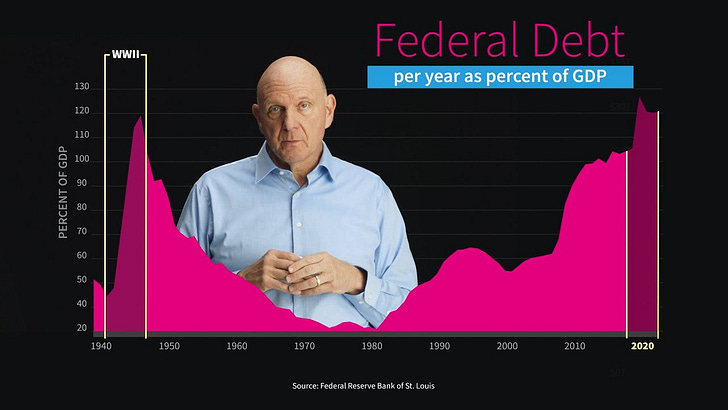
The chart below shows the size of the federal debt as a percentage of GDP. In 1981 total federal debt was 31% of GDP, a postwar low. It has risen steadily since then and is currently at about 120% of GDP.
The last attempt at reducing debt was when President Reagan appointed David Stockman as his Director of the Office of Management and Budget (OMB). Stockman was a fiscal hawk who spent four years fighting Washington in a doomed attempt to curb the deficit.
Stockman resigned in 1985. The national debt of $ 2trn had doubled during his tenure at the OMB.
Stockman later wrote a memoir of his experience in the Reagan Administration titled The Triumph of Politics: Why the Reagan Revolution Failed in which he criticised the failure of Congressional Republicans to endorse a reduction of government spending. This was needed to offset large tax decreases and avoid large deficits and an increasing national debt.
Since 1981, the deficit and federal debt have grown under Republican and Democratic Presidents including President Trump’s first spell in 2016 (see charts above).
It is sometimes argued deficits and debt do not matter as government can always tax or borrow to finance them.
We do not agree. In economics, there are always opportunity costs. If the government borrows too much, surely that will tend to crowd out private sector borrowers and impede private sector capital formation.

In March 2025, U.S. government interest payments are 35.6% of total tax revenues. This is lower than the historical highs but still elevated compared to recent decades. This ratio peaked between 45% and 52% during the 1980s and early 1990s, when interest rates were significantly higher. While current levels remain below these historical highs, they represent a sharp increase from the 24.3% observed as recently as Q3 2023, due to rising interest rates and growing federal debt burden.

Federal spending on debt interest costs is greater than on either Defence or Medicaid. Net interest payments account for 18% of government revenue and account for 12% of government spending
Steve Ballmer, the former CEO of Microsoft now runs an organization which produces information on such data. An example of this can be seen here:
Interest costs are 3% of GDP and the Peterson Foundation estimates they will rise to 4% of GDP by 2035. At that time they will take up 22% of government revenue. Net interest is expected to account for 16% of all Federal outlays by then. The Peterson Foundation article can be found here
As the Peterson foundation article concludes
By any measure, interest costs as part of the federal budget are at an all-time high, and trending even higher in the years ahead. Securing the nation’s fiscal and economic future will mean getting those interest costs under control, which will help relieve pressure within the budget, allow investments in priorities for the country’s future, respond to emergencies, and help ensure a vibrant and inclusive economy for the nation.
President Trump and his advisers realise the path for federal debt and interest costs are unsustainable and need to curtailed urgently.
The Trade Deficit
The Balance of Payments (BoP)
The Balance of Payments are a series of accounting identities used to describe a country’s external trade and its associated financing. We can look at the Balance of Trade, the Current Account or the Capital Account
Balance of Trade (BoT) = Total value of exports - Total value of imports
BoT forms part of the Current Account. The latter is defined as follows:
Current Account (CA) = (Exports − Imports) + Net Income from Abroad + Net Current Transfers.
Capital Account is a measure of the capital transactions and shows how the Current Account is financed if CA is in Deficit) or invested (if CA is a surplus)
The first point about the balance of payments is it always, by definition, must balance.
If a country has a $500bn deficit on the current account, it must have a $ 500bn surplus on the capital account and so the overall balance is zero.
The newspapers or the media usually focus on the BoT or the CA.

Let us consider the data for 2024
Exports of goods increased $38.6bn to $2,083.8bn in 2024. Exports of services increased $81.2 billion to $1,107.8 billion in 2024. So total Exports were about $ 3,190bn.
Imports of goods increased $187.1bn to $3,295.6bn in 2024. Imports of services increased $66.2bn to $814.4 bn in 2024. So total Imports were about $4,200bn
This means the Balance of Trade had a deficit about $1,000bn or 1trn.
The US has run trade deficits since 1976.
The last time the US had a balance of trade surplus was 1975. As we discussed above it is now $ 1trn in 2024 (it was $971bn in 2022).
In a world of multilateral trade , there will always be some countries n surplus and others in deficit. However, to be in deficit for 50 years in a row seems very high and suggests some serious questions about the ability of the country in question to compete in global trade.
This sounds bad. A good way of looking at this is to say the US has had a surplus on the capital account since 1976.
This means foreigners have consistently invested more in the US or in dollar assets than US citizens have invested in non-dollar assets or outside the USA. The USA has been attractive place for foreigners to invest for fifty years.

The above explanation is from an article by Paul Krugman
The Trump administration argues that these deficits have led a persistent decline in manufacturing jobs. US workers have lost jobs, and other countries have gained such jobs. They argue that this is due to unfair tariff regimes, currency manipulation imposed by other countries.
The chart below shows the US Goods trade balance with various countries. The biggest deficits are with China, the EU and Mexico. The US has a (small) surplus with the Netherlands, UK and Brazil.
China and EU have been the target of tariffs by various US administrations.

President Trump and his advisers believe that the balance of payments deficits are not sustainable, and the US must reduce or eliminate them. We agree with them that such persistent trade deficits are not sustainable.
The Trump government realises the debt is unstainable. To reduce it the government spending must be cut.
The trade deficits means that manufacturing jobs have been exported abroad, and manufacturing and the jobs must come back to the USA.
President Trump’s Proposed solutions
·Aim: government spending must be cut.
· The proposed solution is the Department of Government Efficiency (DOGE) led by Elon Musk.
· Aim: to increase investment in manufacturing in the US and boost blue collar manufacturing jobs
· Proposed solution is to impose higher tariffs globally to exporters to relocate manufacturing operations and jobs to the United States.
Let us consider these proposed solutions in more detail
President Trump’s Proposed solutions
Aim: government spending must be cut.
The proposed solution is the Department of Government Efficiency (DOGE) led by Elon Musk.
DOGE is tasked with addressing the U.S. national debt by cutting federal spending. Initially targeting $2 trillion in reductions, this goal was later revised to $1 trillion. Its efforts include workforce reductions, eliminating programs deemed wasteful, and cancelling contracts.
In fiscal year 2024, the US federal government spent a total of $6.75 trillion, which was 23% of the total gross domestic product (GDP) of the United States that year.

Some great data on this has been produced by the Peterson Foundation and it can be found here.
About 61 % ($3.8trn) of total spending is mandatory. This spending is mandated by Congress, and it is politically impossible to cut.
Social Security, Medicare, and Medicaid account for nearly 75% of mandatory spending. This is about $2.5trn As you can imagine these are very difficult to cut. President Trump ruled out cuts to them in his tariff speech on April 2nd.
Social Security and Medicare spending is growing by ~$180 billion annually. By 2028 that's $3.5 trillion a year. Medicaid grows with population and inflation (3% to 4% a year). By 2028 that's $2 trillion a year
S1.7bn in 2023 was discretionary but 53% of that was made up of defence spending which is very difficult to cut. About US$ 1trn is non-defence discretionary. Even if that was cut by 20% (which is almost impossible) it will only $ $200bn
The final 700bn is interest on existing debt. As deficits are projected to grow this can only grow unless it can be offset by lower interest rates and bond yields
Between now and 2028, the Fed has to refinance $21 trillion! The Congressional Budget Office predicts rising deficits over the next four years, with an estimated $9 trillion in new federal borrowing expected.
The government will need to sell $30 trillion worth of U.S. Treasury bonds to investors over the next four years. Investors will only buy such debt if they get higher yields.
Foreigners collectively hold $8 trillion in U.S. Treasury securities, or about 27% of all of debt. They have been selling.
Perhaps domestic investors will take up the slack. They will need higher bond yields and therefore great spending on interest rate costs.
DOGE is unlikely to hit its target of cutting expenditure by $ one trillion
Trading markets expect that the cuts achieved by DOGE are likely to be between $ 1bn and $50bn. At the higher figure this is just 5% of the target. You can see it here.
Many of the cuts will actually cost money, including via the taxpayer salaries going to an army of lawyers from the Department of Justice battling a cascade of court cases against the government’s dismantling that many judges have already said appears to be illegal.
As David Stockman found in 1981, it is very hard to cut government spending in the US. The same is true in other developed countries
Most people are generally in favour of cutting government spending and waste
However, they do not want programmes that benefit them personally to be cut
The military veteran will be in favour of lower Federal spending but will want his VA benefits protected as he fought for the country
The steelworkers will be in favour of lower Federal spending but will want subsidies for his industry .
Senior citizen believe they deserve Medicare
Welfare recipients and those who are ill feel they deserve their benefits. Everybody wants you to cut somewhere else.
In addition, Washington is the home of what President Trump used to call the swamp. These included lobbyists whose job is to influence the course of future legislation and ensure that government spending grows and benefits their clients. For example, military spending should have fallen after the collapse of the Soviet Union. However, the lobbyists in the swamp representing the military industrial complex ensured it did not.
The deficit is likely to grow and therefore Federal debt will continue grow.
The Trade Deficit and Tariffs
Aim: to increase investment in manufacturing in the US and boost blue collar manufacturing jobs
The proposed solution is to impose higher tariffs globally to exporters to relocate manufacturing operations and jobs to the United States.
The first question to ask is What are Tariffs?
There is a timely article by the Council for Foreign Relations (CFR) which has this exact title and it can be found here.
Countries around the world have long used tariffs, a tax on imports, to prop up homegrown industries by inducing citizens to buy goods produced domestically. After World War II, however, tariffs largely fell out of favour in advanced economies because they often lead to reduced trade, higher prices for consumers, and retaliation from abroad. - CFR
The chart below shows US tariffs were high from 1820s to 1940. In the 1930s, Congress raised close to nine hundred separate tariffs with the 1930 Smoot-Hawley Tariff Act. This led to retaliation by other countries, a collapse in global trade and the great depression

In the post war financial and commercial framework designed by the US included the World Trade Orgnisation (WTO) and the General Agreement on Tariffs and Trade (GATT). Both Democratic and Republican governments in the post-war era worked to reduce tariffs and non-tariff barriers to trade.
This reduction in tariffs helped global trade grow, increased global specialisation and boosted economic growth. It was a golden age of globalisation.
Tariffs Charged to the US
According to the World Bank, the median tariffs imposed on the USA by different types of countries in 2021. The data is as follows:
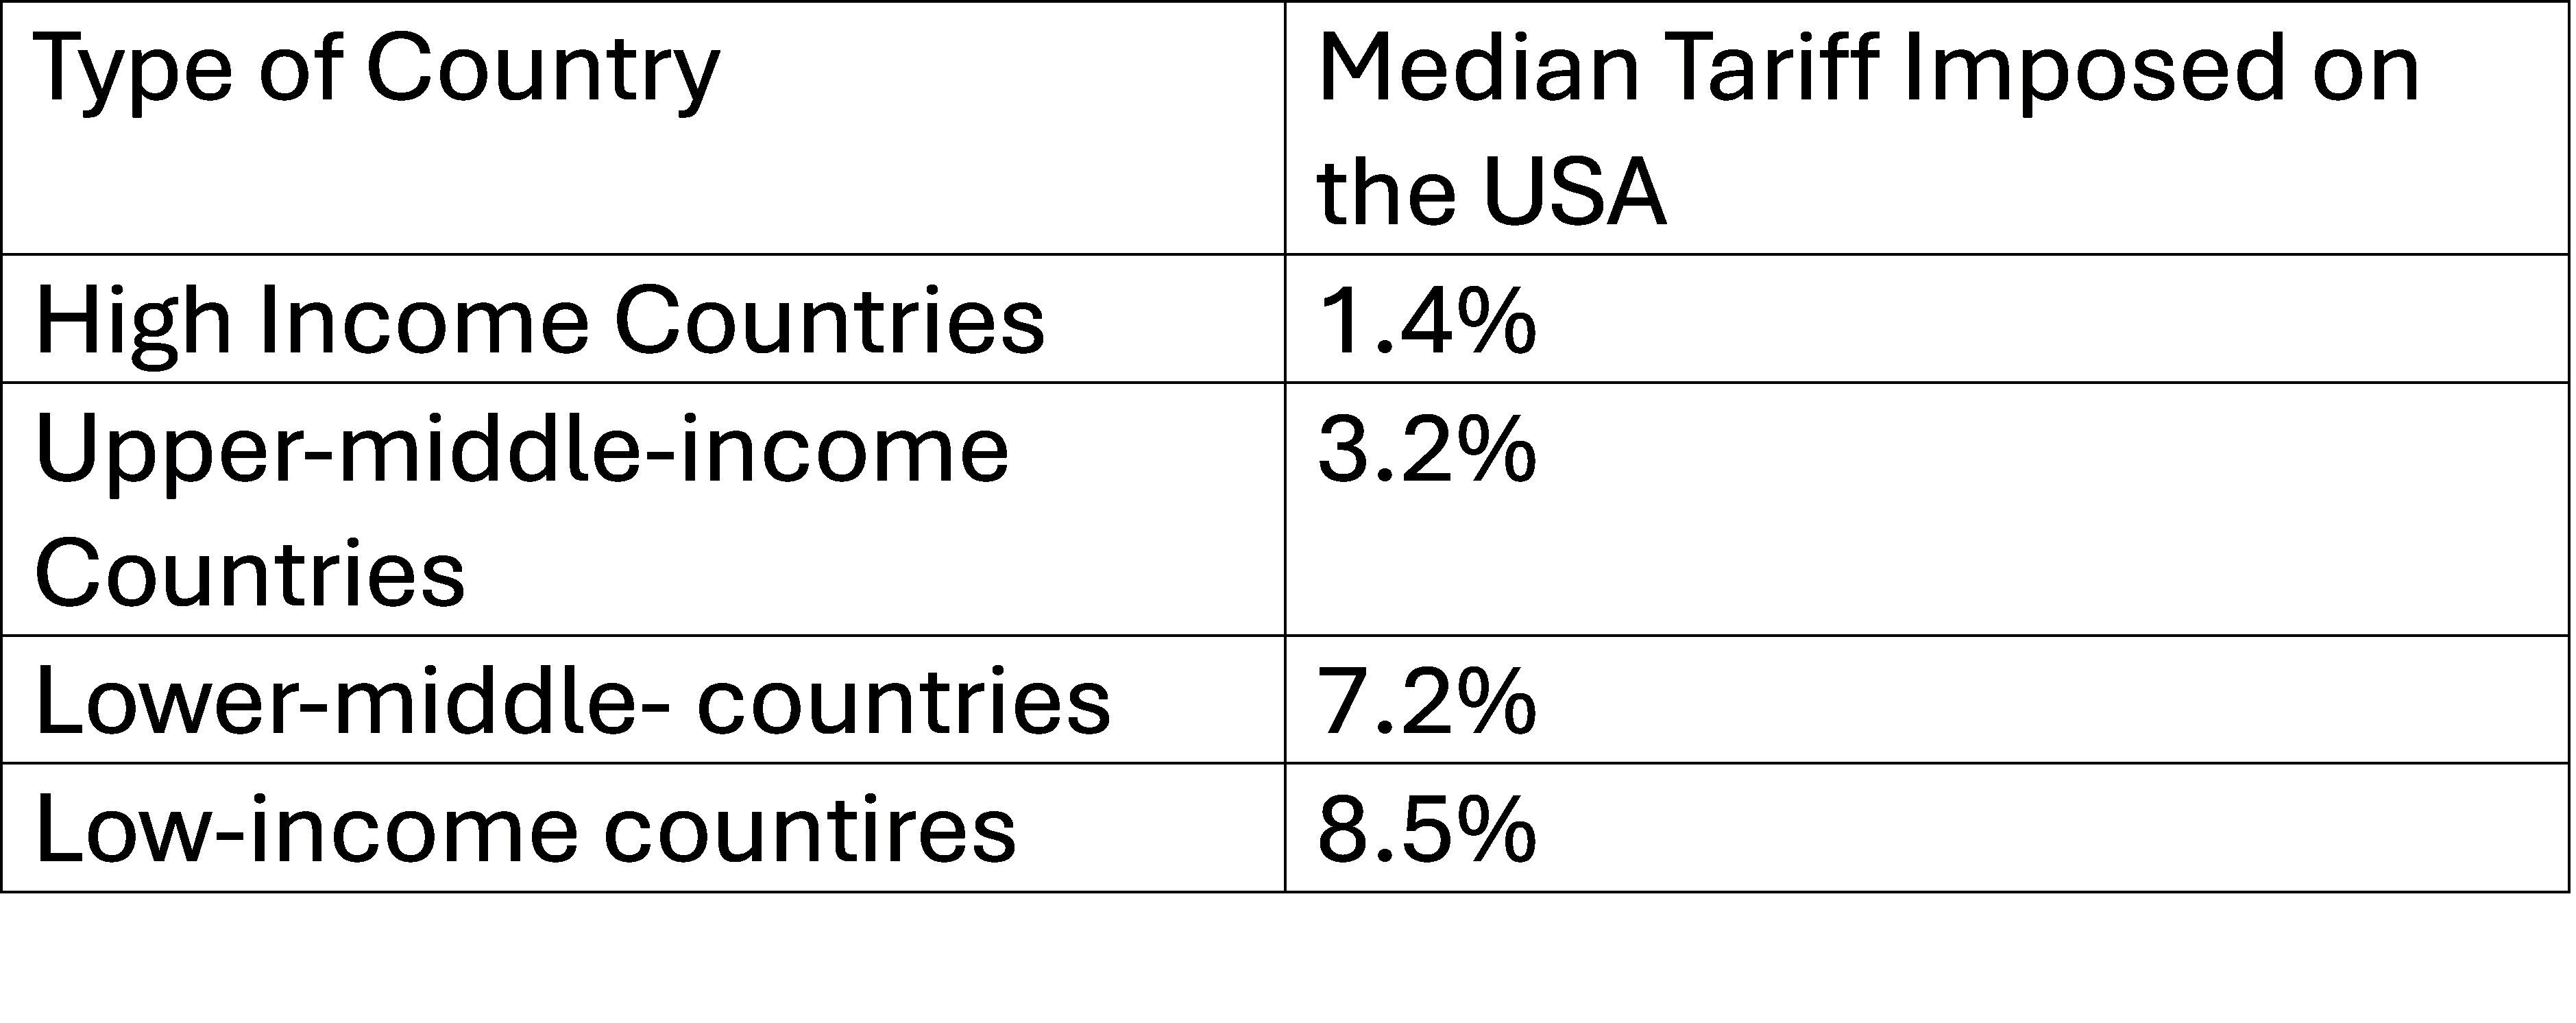
The rich countries who are the major trading partners of the USA have low tariffs
The countries which have higher tariffs are poorer countries who are not important trading partners of the USA.
More granular data on this is shown below
Korea, Brazil and India do look like outliers and there many be a strong case for them to reduce tariffs. As the chart below shows, the US has been targeting some of these countries with tariff investigations

The Trump Tariffs look disproportionately high. If they are imposed and sustained for some time, they would lead to a replay of the 1930s.

The measures announced by the President will see Tariffs rise to the highest level in decades. They will invite retaliation, tit for tat currency devaluations, regional trading blocs. It will be replay of the 1930s.

In general tariffs are not very high and are unlikely to explain the loss of manufacturing jobs suffered by the US in the last five decades. The differences in factors such a labour costs gave bee much bigger and they are likely to be a more important factor in manufacturing job migration.
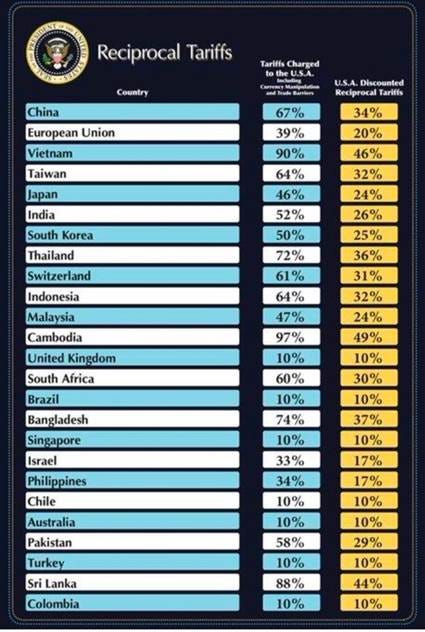
The numbers in the middle column above, presented by the White House have little to do with tariffs. They are just the approximate percentage difference in trade balance. For example: - U.S. exports $17.7bn to Thailand and imports $63.3bn from Thailand = $45.6B imbalance. 45.6/63.3=0.72%. This is a meaningless basis on which to determine the tariffs to be charged.
Importers pay tariffs to their home government, but most economists find that the bulk of tariff costs are passed on to consumers. This is particularly true for industries with small profit margins, such as retail. This means that inflation will rise in the USA and poor people will be disproportionately affected.
Recent Research has found that U.S. consumers have indeed “borne the brunt” of the tariffs on Chinese goods through higher prices. Other studies have noted that with tariffs on their foreign competitors, domestic producers can safely raise their prices. Ultimately, consumers share the burden of tariff with importers.
These inflationary impact will be immediate. If there is tariff retaliation by other countries, there will be declines in trade volumes and this will negatively impact economic growth.
Therefore, the first impact of high tariffs imposed by the US will be a combination of higher inflation and economic stagnation otherwise known as stagflation. There will retaliation and a Trade War and line any war, there will be no winners.
In the long run high tariffs may encourage some exporters to relocate to the USA and manufacture there. However, this will take a long time, and we do not expect to see it happen on a large scale. This will require labour costs in the USA to be much lower than they are currently. In general wages are not very flexible in a downward direction.
Even if some manufacturing activity does relocate to the USA, the impact of jobs may not be as high as one many expect. The reason is that manufacturing has become less labour intensive in the last five decades and this trend is likely to continue in the future due to developments in automation and robotics
The chart below shows the decline in the manufacturing share of employment. It has declined from 25% in 1970 to below 10% today.
According to Paul Krugman “Manufacturing as a share of employment has fallen about 17 points since 1970. Complete elimination of the trade deficit would undo only around 2.5 points of that decline.”
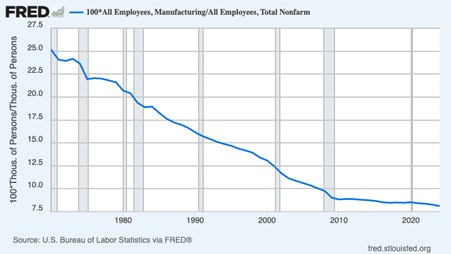

Source : Paul Krugman
However, we can see the same trend in Germany which has not suffered any significant decline in its manufacturing industry. Manufacturing output has grown but the sector employs fewer people.
According to Paul Krugman “If Germany’s huge trade surpluses haven’t been enough to avoid a big shift away from manufacturing, even ending U.S. trade deficits (which Trump’s tariffs won’t achieve) wouldn’t make us a manufacturing-centric economy again.”
“So even if tariffs “worked,” which they won’t, they would fall far short of restoring manufacturing to its former glory. The fact is that the world needs fewer manufacturing workers than it used to, just as it no longer needs a lot of farmers, and even countries that run big surpluses in manufacturing trade can’t buck that trend.”
High tariffs by the USA are likely to a prolonged period of stagflation which will lead to much economic hardship.
Eventually the high tariff walls may encourage some manufacturers to shift to manufacturing in the USA. However this is not likely to be significant unless US labour costs sharply below current levels – an unlikely development.
Even if there is some relocation of manufacturing capacity, it is unlikely to have a significant impact on employment as technological advancements have ensured that manufacturing has become more capital intensive and less labour intensive over time.
The political problem for the Trump administration is simple: economic pain from the tariffs will come almost immediately, but the gain- long term restructuring of the economy- will take years.
So the federal debt is likely to grow and balance of trade deficit is unlikely to narrow.

The IMF estimates the US deficit will narrow in the next few years but it will still be 2% of GDP.
Some economists have a argued that deficits do not matter. The US is large productive economy with huge resources. If it runs a deficit every years, foreigners will gain a claim on US assets every year.
This means the US is selling off about 2-4% of its GDP every year to foreigners either in the form real assets such as property or stocks or IOUs such as US Treasury bonds or corporate bonds etc.
The US huge resources and the largest financial markets. This means the trade deficits can be easily financed. It may have been easy in the past, but it is going to be less easy as debts rise and as foreign investors including central banks diversify away form the dollar into gold and other currencies.
Both the fiscal deficit and the trade deficit must be financed.
Investors (domestic and foreign) have to be persuaded to buy US government debt
Foreign investors must persuaded to invest in dollar denominated assets including Treasury Bonds.
A high proportion of US financial assets are already held by foreigners.
As of January 2025, foreign countries own approximately $8.5. trillion in Treasuries — or 23.9% of total US debt. Of this, 50% was owned by central banks and other government entities. US$ 1trn was held by Japan and about $ 750bn by China. It is estimated that foreigners hold about 30% of US stocks.
Will they continue to have confidence in US assets and be willing to hold more of them?
In part the US has been able to run trade deficits for fifty years because of the rule of the US dollar as a reserve currency. Foreigners are happy to hold dollars as it is the main global exchange currency for global trade and investment. This is an exorbitant privilege which allows the US to run persistent trade deficits.
We think investors will be reluctant to continue to hold US dollar denominated assets especially if they think the US government is pursuing policies deliberately designed to drive down the US dollar.
The US government may deal with its US$ 35.5trn and growing debt by high inflation, a falling dollar which will reduce the value of the debt and impose huge losses on foreign investors. In the end it may be the logical outcome to current trends.
Conclusions
The future looks difficult for equity investors especially in the US . Trade wars are not good for global trade and the global economy. Perhaps gold may be the safest investment. We have to consider these issues urgently in future articles.
The calculation used by the White House for the tariffs charged by other countries used goods exports as a proportion of the sum of goods exports to US and Goods imports from the USA. This not a measure of the tariffs employed by the country. In any case it only look at Goods and not Services. Why ? is a dollar earned by exporting goods worth more than a dollar earned by exporting services. Take the EU - they mostly export goods to the US and import services. They got a high tariffs as the calculation only take goods into account. however, if you take services into account you find that EU is hardly protectionist and would merit the minimum 10% tariff.