Amazon
Some comments on Amazon in the light of recent quarterly results. I will not comment in detail on the results as these have been well covered elsewhere.
It is sometimes argued the the stock market is too short-term. It is claimed that analysts and investors are obsessed by the next quarters’ results and rarely focus on the outlook beyond two years. This attitude forces management to take a myopic perspective and discourages a focus on the long term. It is a good starting point for an academic argument. However, if the argument is true, how does one explain Amazon Inc?
For two and a half decades since its IPO in 1997, Amazon has invested for high sales growth and foregone high profits and free cash flow growth. It has grown at a remarkably relentless pace and has been rewarded by stock market investors by high multiples and a rising share prices despite poor margins and Free Cash Flows .
Amazon is is one of the most remarkable companies of the last fifty years.
As is well known, it started off as an internet book store and became
an online retailer of virtually everything,
a large provider of cloud hosting services to everybody (AWS)
a provider of distribution logistics services to nearly two million 3rd party retailers
a major seller of online advertising to major brands,
a designer and manufacturer of electronic devices (Kindle, Echo, Alexa, Ring, Roomba) and computer chips (Graviton),
an offline Bricks and mortar store retailer (Whole Foods, Amazon Books etc)
a producer and streaming broadcaster of television programmes and films (Amazon Prime, Fire TV),
a supplier of Primary Medical Services (One Medical) , driverless transport (Zoox), electric vehicles (stake in Rivian) and many other products and services ( eg Audible, 1Mdb) etc etc.
Anybody who wishes to understand the company should read founder Jeff Bezos’s 1997 inaugural shareholder latter . We summarise it below but interested readers can read it here.
Early on in the letter, Bezos says “…this is Day 1 for the Internet and, if we execute well, for Amazon.com. Today, online commerce saves customers money and precious time. Tomorrow, through personalization, online commerce will accelerate the very process of discovery. Amazon.com uses the Internet to create real value for its customers and, by doing so, hopes to create an enduring franchise, even in established and large markets.” (bold Italics mine)
“Our goal is to move quickly to solidify and extend our current position while we begin to pursue the online commerce opportunities in other areas. …This strategy is not without risk: it requires serious investment and crisp execution against established franchise leaders.
It’s All About the Long Term
We believe that a fundamental measure of our success will be the shareholder value we create over the long term. … The stronger our market leadership, the more powerful our economic model. Market leadership can translate directly to higher revenue, higher profitability, greater capital velocity, and correspondingly stronger returns on invested capital. Our decisions have consistently reflected this focus.”
“We first measure ourselves in terms of the metrics most indicative of our market leadership: customer and revenue growth, the degree to which our customers continue to purchase from us on a repeat basis, and the strength of our brand.”
“We have invested and will continue to invest aggressively to expand and leverage our customer base, brand, and infrastructure as we move to establish an enduring franchise.”
Because of our emphasis on the long term, we may make decisions and weigh trade-offs differently than some companies. Accordingly, we want to share with you our fundamental management and decision-making approach so that you, our shareholders, may confirm that it is consistent with your investment philosophy:
We will continue to focus relentlessly on our customers.
We will continue to make investment decisions in light of long-term market leadership considerations rather than short-term profitability considerations or short-term Wall Street reactions.
We will continue to measure our programs and the effectiveness of our investments analytically, to jettison those that do not provide acceptable returns, and to step up our investment in those that work best. We will continue to learn from both our successes and our failures
We will make bold rather than timid investment decisions where we see a sufficient probability of gaining market leadership advantages. Some of these investments will pay off, others will not, and we will have learned another valuable lesson in either case.
When forced to choose between optimizing the appearance of our GAAP accounting and maximizing the present value of future cash flows, we’ll take the cash flows.
We will share our strategic thought processes with you when we make bold choices (to the extent competitive pressures allow), so that you may evaluate for yourselves whether we are making rational long-term leadership investments.
We will balance our focus on growth with emphasis on long-term profitability and capital management. At this stage, we choose to prioritize growth because we believe that scale is central to achieving the potential of our business model.
Obsess Over Customers
From the beginning, our focus has been on offering our customers compelling value. We realized that the Web was, and still is, the World Wide Wait. Therefore, we set out to offer customers something they simply could not get any other way, and began serving them with books. We brought them much more selection than was possible in a physical store (our store would now occupy 6 football fields), and presented it in a useful, easy to-search, and easy-to-browse format in a store open 365 days a year, 24 hours a day.
We maintained a dogged focus on improving the shopping experience, and in 1997 substantially enhanced our store. We now offer customers gift certificates, 1-ClickSM shopping, and vastly more reviews, content, browsing options, and recommendation features.
We dramatically lowered prices, further increasing customer value. Word of mouth remains the most powerful customer acquisition tool we have, and we are grateful for the trust our customers have placed in us. Repeat purchases and word of mouth have combined to make Amazon.com the market leader in online bookselling.”
Bezos is a visionary and the letter is a remarkable document. The essential DNA of the company, which drove it relentlessly forward, for two and a half decades is all there. The strategy is to obsess over the customer, make bold choices, invest heavily to generate market growth and achieve scale. This require sacrificing short term profits for maximising long-term free cash flows and profits.
Bezos reprinted the first letter in all subsequent letters to shareholders. The Day1 concept was a reminder that the company should always operate as if it were its first day in business.
A few years ago when Amazon had become a huge marketplace and logistics provider for millions of 3rd party sellers, Bezos illustrated the company’s flywheel on a napkin and his drawing is shown below.
The Day 1 vision has been realised in spades in the last 25 years as shown in the charts below:
Chart 1: Amazon 20-year Revenue Growth
Amazon Revenues grew from US$ 4bn in 2002 to US$ 514bn in 2022. The phenomenal growth shows the success of the strategy outlined by Bezos in 1997. Sales grew very strongly in December 2020 and 2021 due to the impact of the Covid-19 Pandemic.
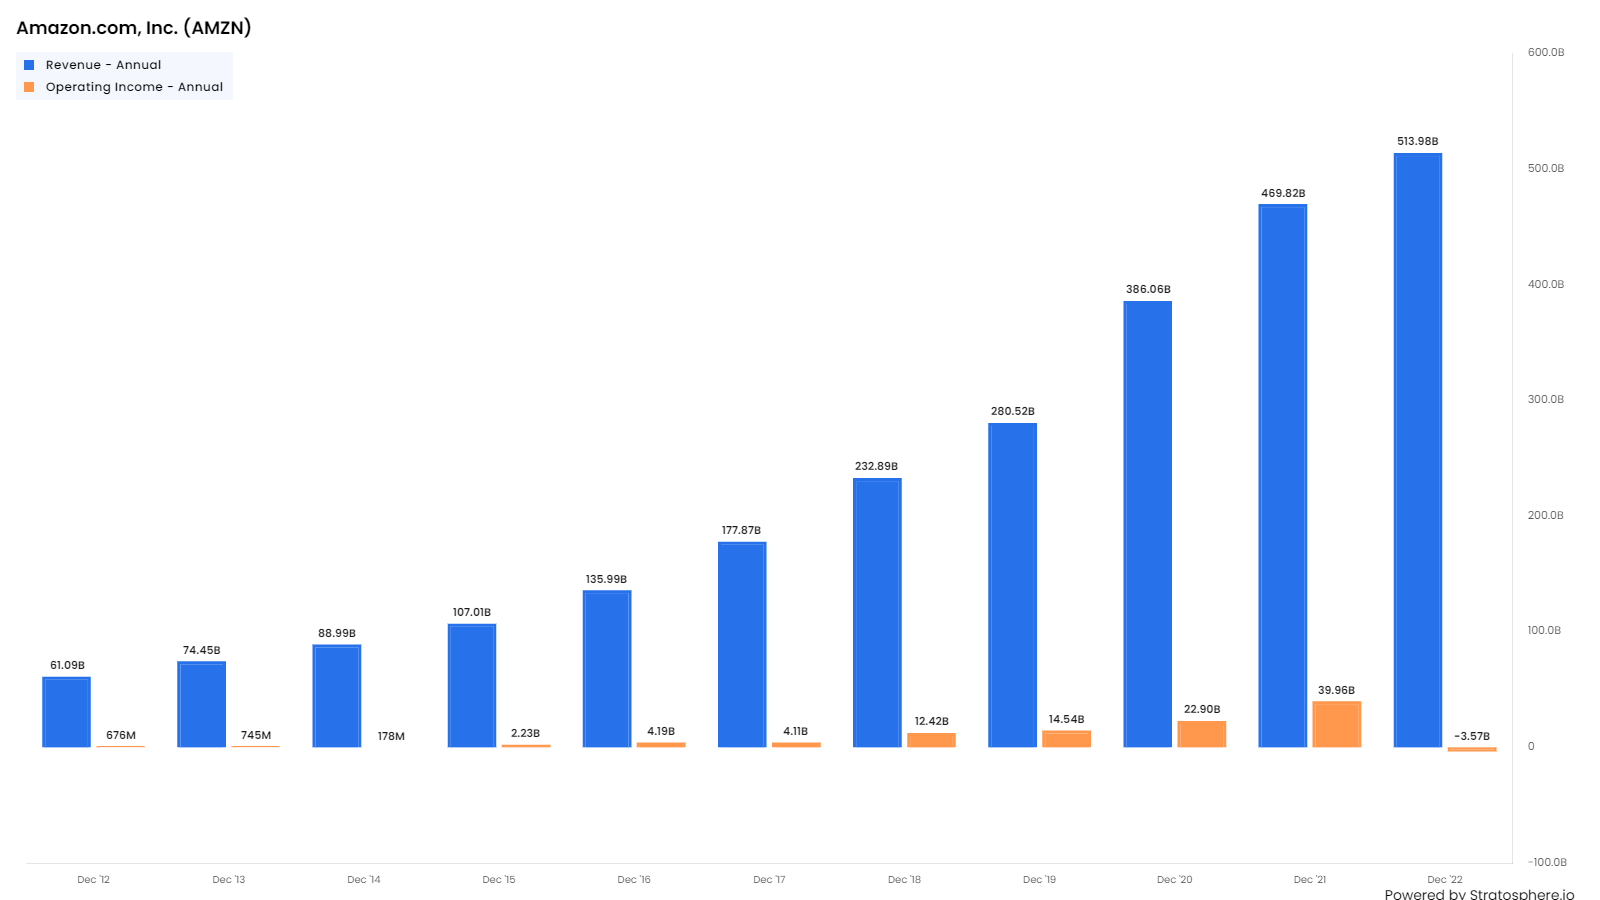
Chart 2: Amazon 10-year Revenue Growth and Operating Profit Growth.
The growth in operating profit has been much less impressive than growth in sales. In 2021, Revenue was US$ 470bn and Operating Profit was just below US$ 40bn (an operating margin of 8.5%).
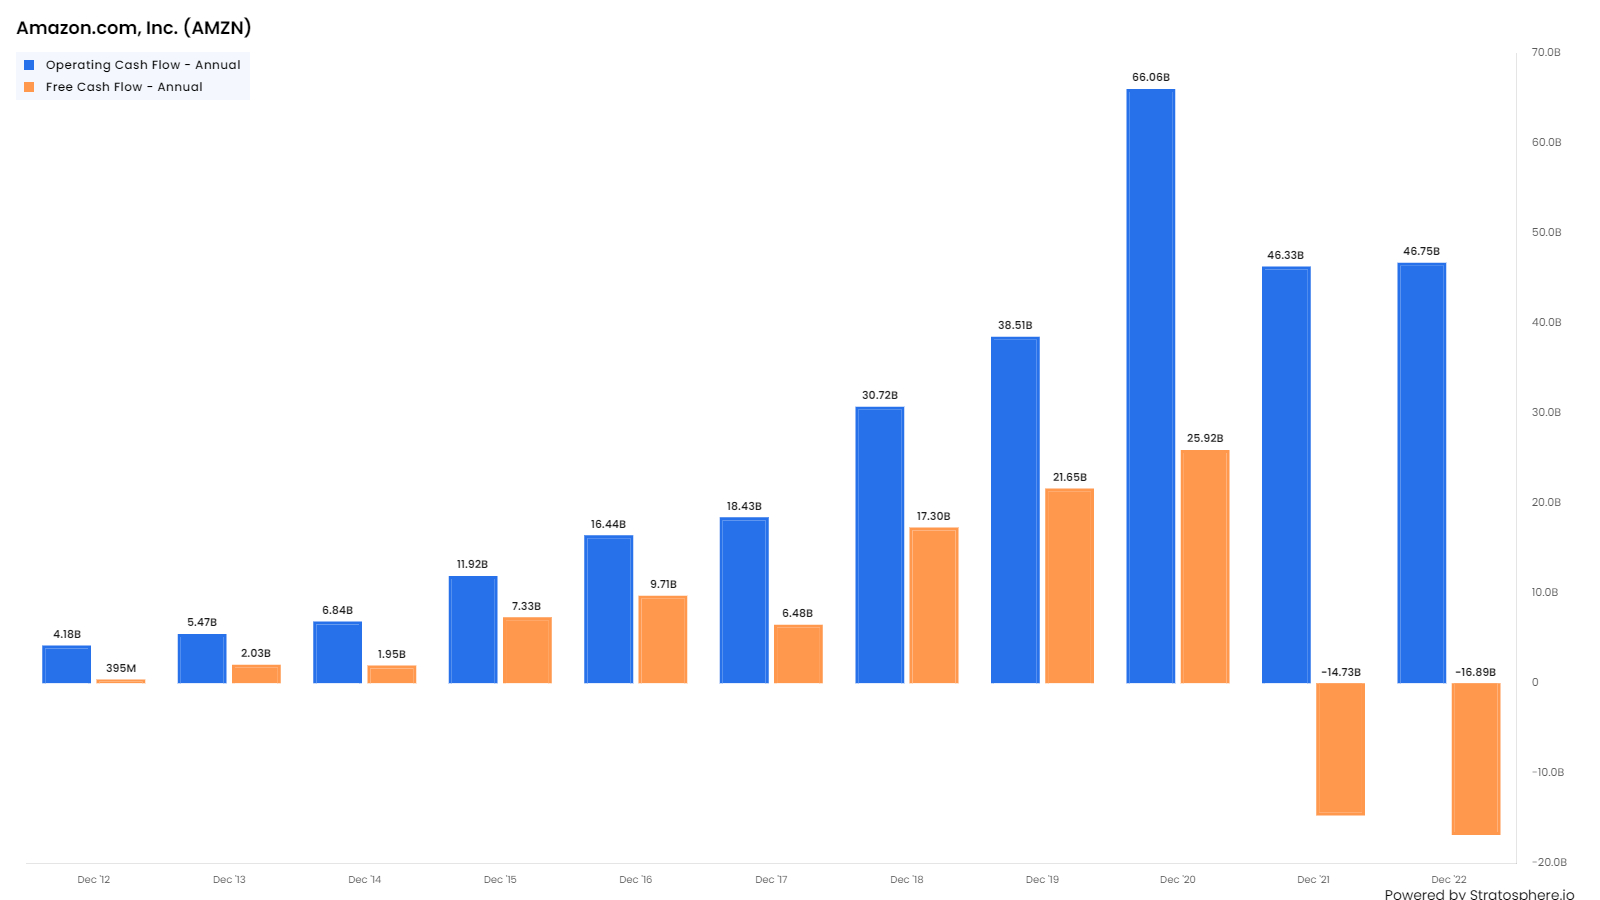
Chart 3: Amazon 10-year Operating Cash Flow and Free Cash Flow.
Free Cash Flow is much less than Operating Cash Flow as Amazon has consistently invested to boost capacity and drive future growth. Amazon saw huge demand in 2020/21 during the COVID-19 pandemic and responded by boosting investment. Capital expenditure in 2021 and 2022 was about US$ 60bn and US$ 63bn respectively. This led to Free Cash Flow becoming a negative US$ 14.7bn and US$ 16.9bn respectively.
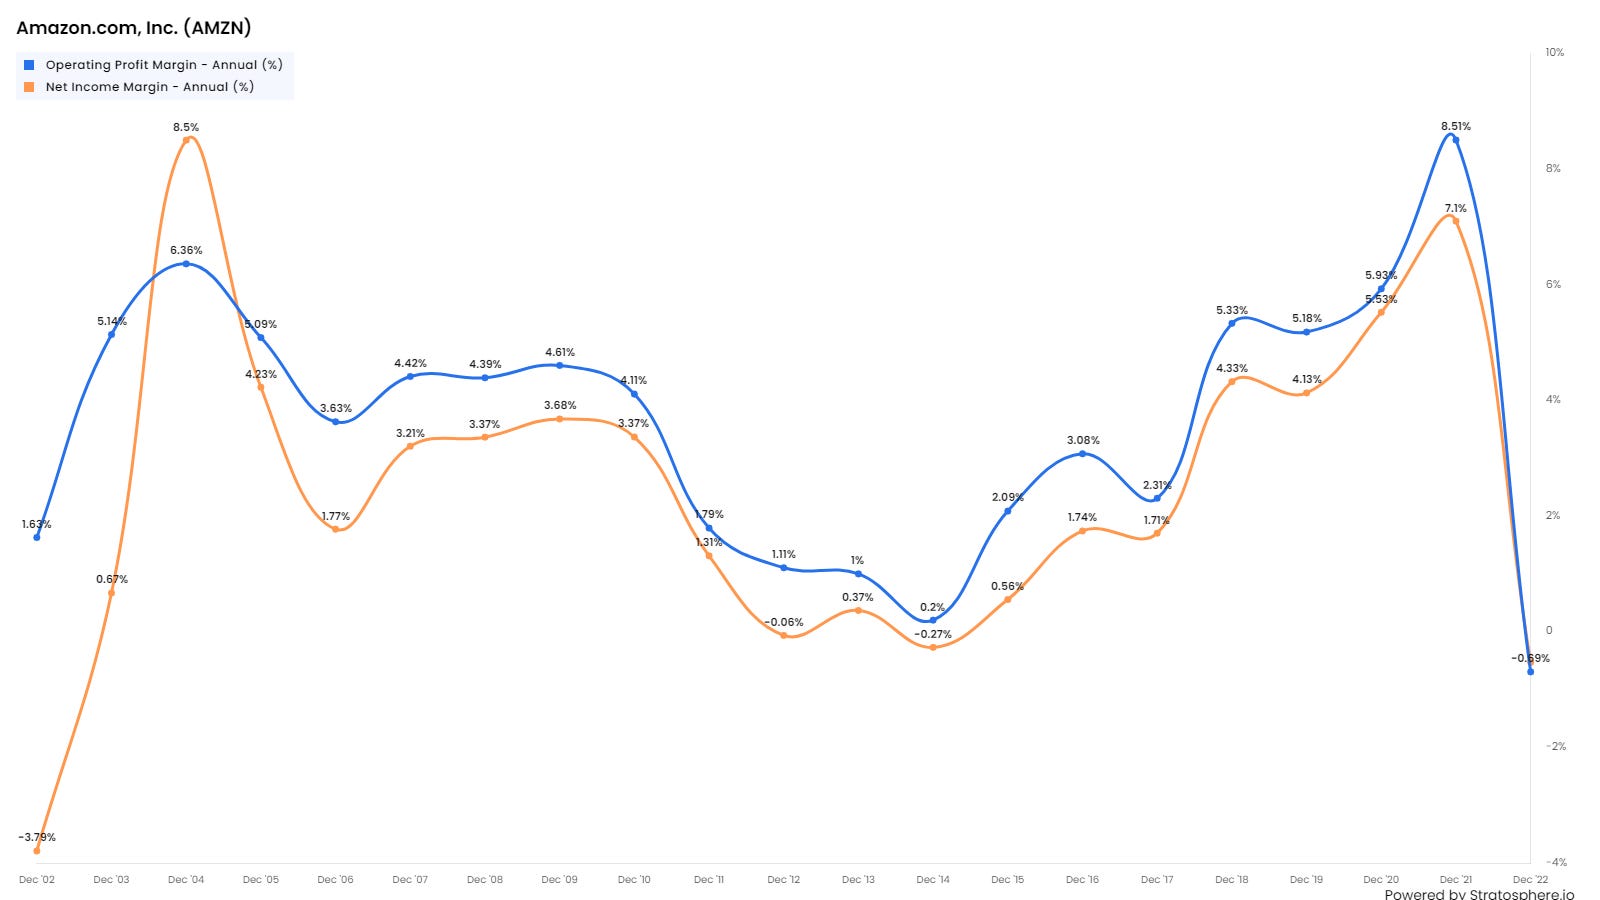
Chart 4: Amazon 20 year Operating and Net Income Margin.
Amazon’s Profit Margins have been low both at the Operating Profit level and the Net Income level. Margins did increase in 2016 to 2020 reflecting the very high growth of the higher margin AWS business. As the chart below shows AWS operating margins are around 25% -much higher than the retail business and the average Amazon operating margin.
To some extent low margins are a fact of life for the whole retail sector and one should not be too worried about this if profitability as measured by Return on Equity (ROE) and Return on Invested Capital (ROIC) is high and/or growing.
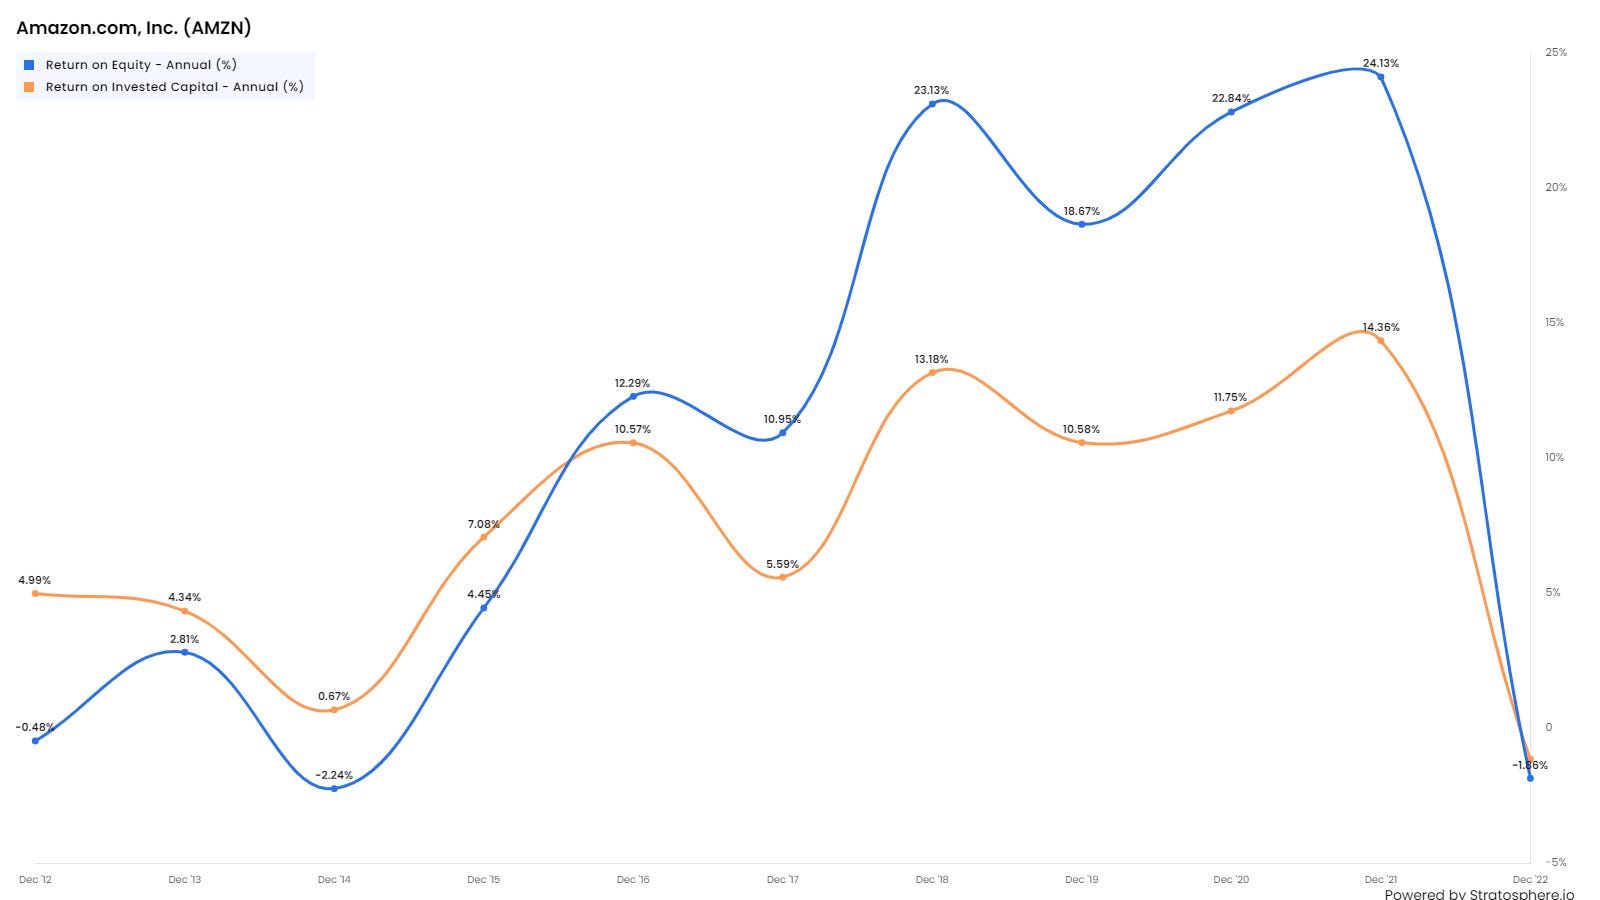
Chart 5: Amazon 10 year ROE and Return on Invested Capital (ROIC)
The low margins notwithstanding, Amazons profitability has improved in recent years. The ROE went above 10% for the first time in 2016. It rose to over 23% reflecting the faster growth of the more profitable AWS business. The chart below shows AWS revenues consistently grew at 40% to 50% in 2016 to 2019. This helped boost margins and profitably. However, the most recent quarterly growth at 16% (q-o-q) was the lowest in five years. AWS growth has been much less than that of Azure - the smaller cloud hosting unit of Microsoft as the latter has been catching up impressively.
Chart 6: AWS Sales Growth compared with Microsoft Azure.
Chart 7: Amazon Price to Sales Ratio
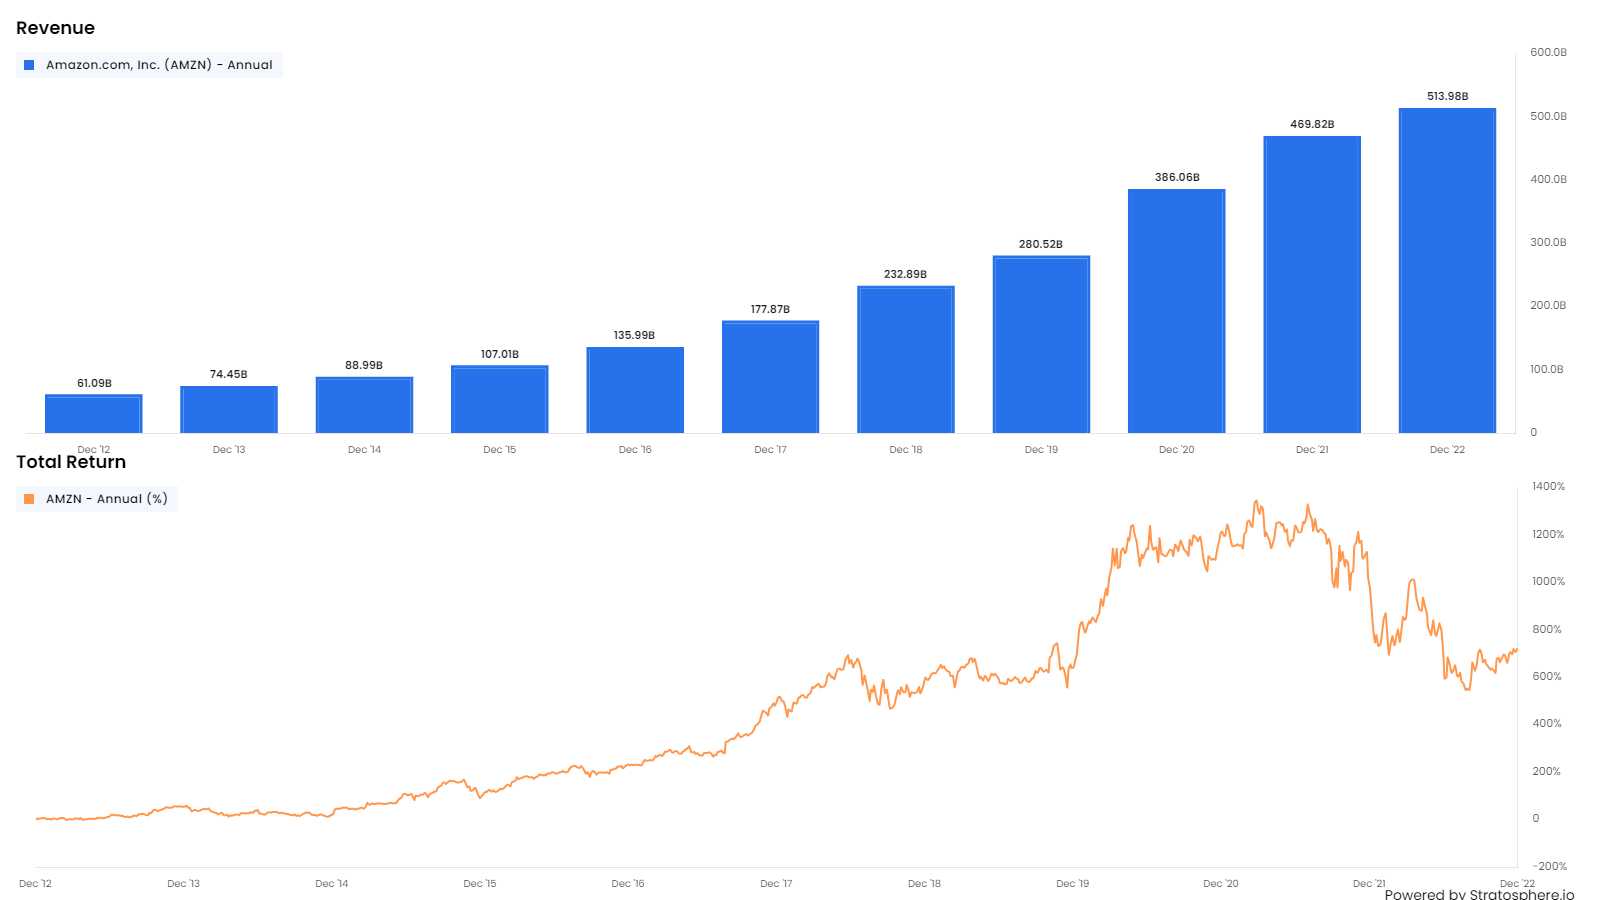
The stock market has consistently valued Amazon at a Price to Sales Ratio of 2.0 to 3.5 times. As sales have risen, the stock price has followed (see below) and has risen about 700% (7X) since December 2012.
Chart 8: Amazon 10 year Sales Growth and Total Stock Return
Chart 9 : Price to Sales Ratio for Walmart
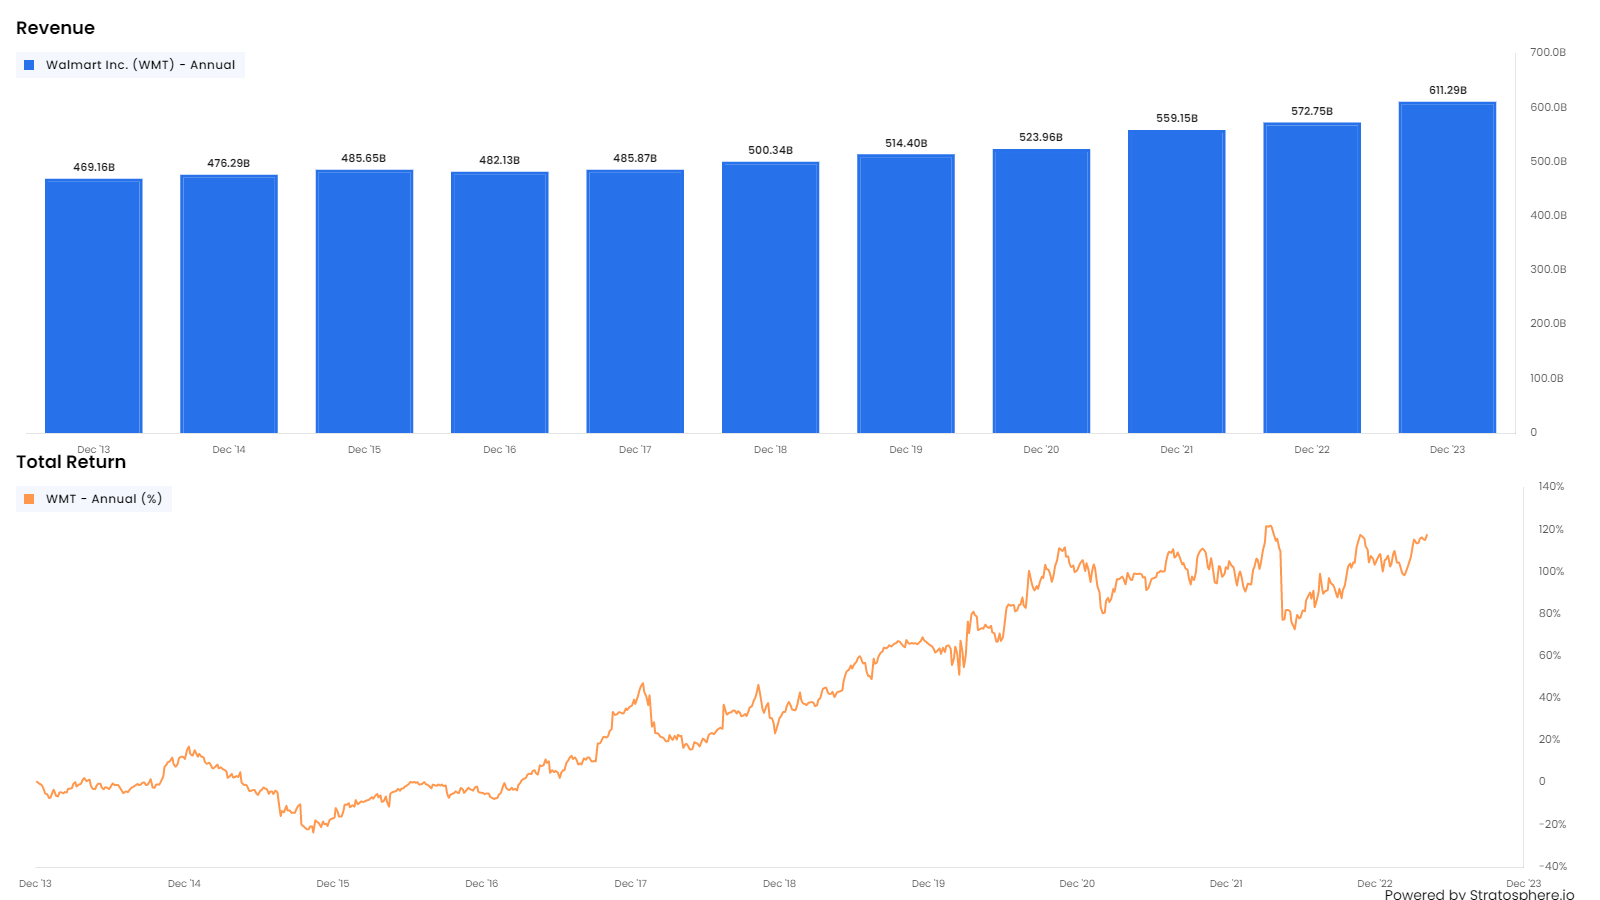
As a comparison, Walmart (WMT) trades on a Price to Sales ratio of 0.6 to 0.7 times. WMT sales have risen more modestly than Amazon and the shares have risen 120% in the last ten years.
Chart 10 : Walmart and Amazon 20-year Sales Growth
WMT sales have grown 3x in the last twenty years. Over the same period, Amazon sales have have risen 100X
Chart 11: Walmart 10- year Sales Growth and Total Stock Return
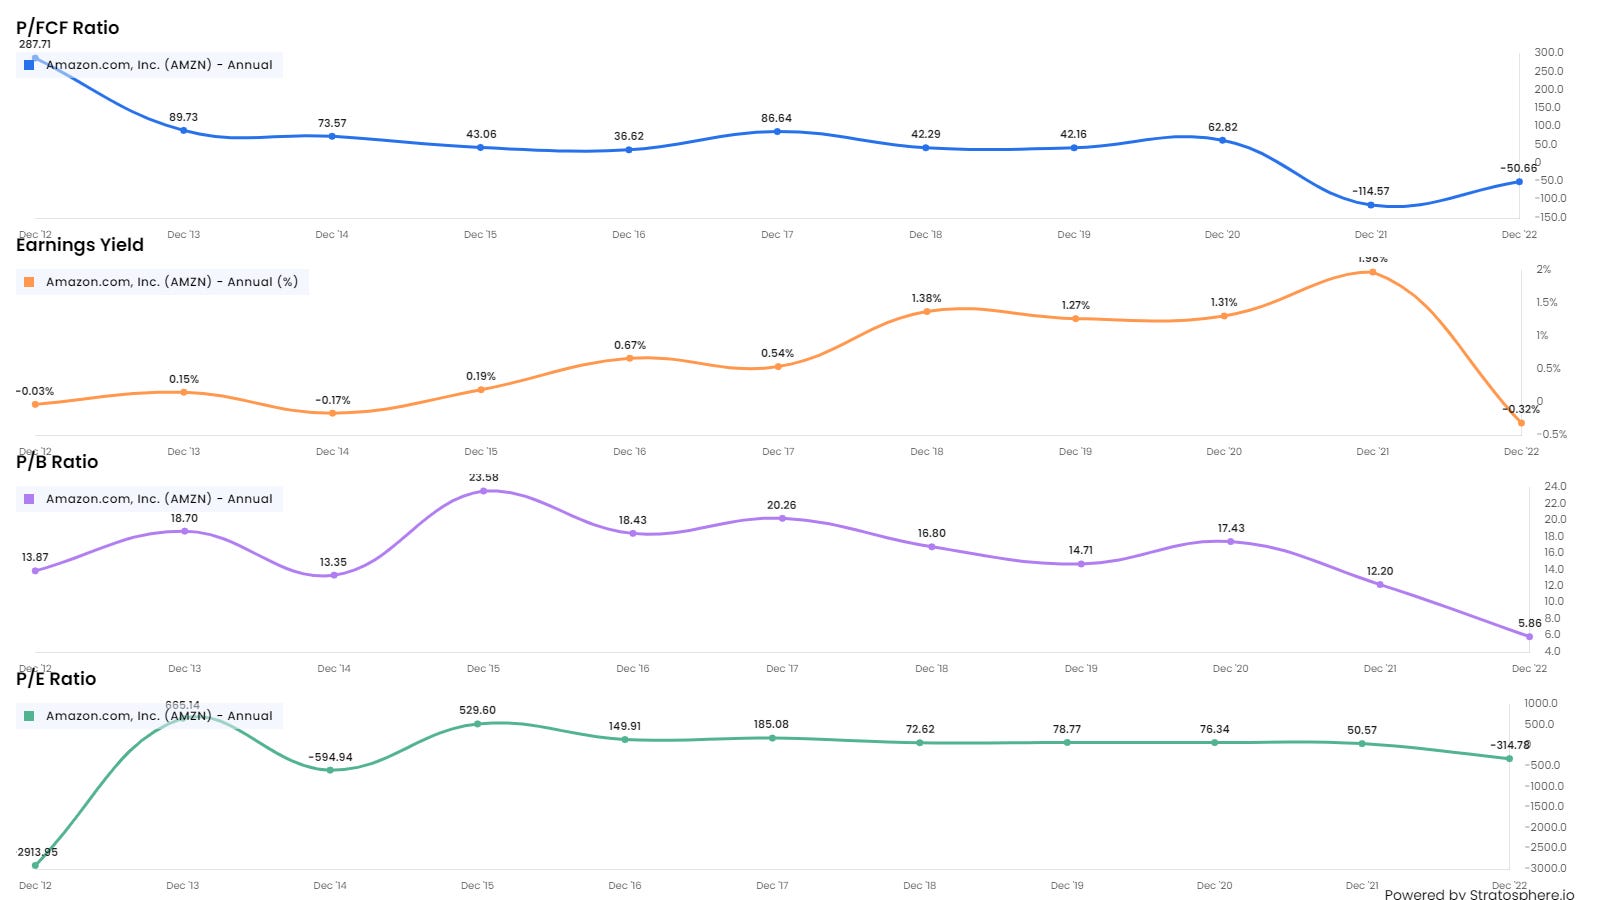
The foregoing has amply shown that Amazon is not a conventional company but it has given unconventional returns. Investors who used conventional relative valuation measures such P/E Ratios, Earnings Yield (E/P), Price to Book ( P/B) and Price to Free Cash Flow( P/FCF), all shown in the chart below, would probably have come to the conclusion that the stock was too expensive and not buy the stock. These investors missed out on a great investment. Sadly, I include myself in this group as I never bought Amazon shares as it just looked too expensive at most points in time. A Value Investor would be uncomfortable buying at a stock at a P/E Ratio of 80 times.
Chart 12: Conventional Relative Valuation Ratios for Amazon
One investor who took a large stake in Amazon in the early 2000s, and held the stock for over a decade, was Nick Sleep of the Nomad Investment Partnership. Sleep bet on Amazon soon after the dotcom bubble when they were trading at less than US$30 per share. Regulatory filings show by 2007 Nomad held 1.4m shares in Amazon, then worth US$55.2m. By 2014 —the year it closed— Nomad held 2,926,232 shares, worth US$1.2bn. In 2014, when he closed his fund, Sleeps recommendation was to merely hold just three shares, Amazon, Costco and Berkshire Hathaway.
Sleep took a different view on Amazon because he understood early that an online retailer was very different from a bricks and mortar entity and face far fewer growth constraints. His explanation is interesting and we quote it here in full.
“Unlike traditional retailing, where growth is bounded by the physical constraints of a building’s size, location, and opening hours, internet retailing has no such constraints. We could all, for the sake of argument, decide to do all our shopping online next week, and Amazon et al would take the orders. Odd, then, that the growth rate in revenues at the main internet-based retailers is, very broadly, comparable to that enjoyed by a physically constrained retailer, say, Wal-Mart, at a similar stage in its development. So what is going on?
…our hunch is that the growth rate in online retailing is held back by consumers’ psychological biases. We are all creatures of habit, and most of us give up comfort blankets quite reluctantly. It therefore takes time for a new regime to be adopted and, for instance, to buy books online instead of buying them at the local store.
In high street retailing we can estimate, broadly, what revenue growth for each firm will be next year: it is a product of same store sales growth plus any new stores. We might not be precisely correct about either number, but the range is bounded and so we can make a reasonable, “generally-right” (as opposed to “precisely wrong”) estimate. When investors think about the future of a business, they often have in mind the assumption that growth rates slow with time, as competition ekes away advantages and marketplaces become saturated. Predicted revenue growth rates (used in valuation models) therefore start high and end low. This is especially true for firms that are quite large already.
However, if the rate of growth in internet retailing is a product of attitude, rather than assets, then, the fact that a firm is quite large already does not necessarily tell you that its growth rate is set to slow. The widely held presumption that regression to the mean begins the moment the analyst picks up their pen, risks being wrong footed as a result. Two years of forty percent revenue growth, for example, will result in revenues doubling in twenty-four months and regression to the mean-based estimates would be out by almost a factor of two! That did not take long. In other words, although some online retailing firms may be quite large, they may also be quite young. In our opinion, it is this realization that has partially driven the revaluation of internet retailers these last few years.”
Sleep was also a fan of Costco and had invested in them before Amazon. He identified a fairly unique business model in Costco which called Scale Economies Shared (SES). Due to scale and buying power, Costco is able to extract a higher margin. It shares a large part of this with customers. As is well known, Costco makes over 90 % of its net profit from membership income (which has a 100% Gross Margin) and limits its overall Gross Margin to just 13% by reducing prices to customers. This does not make sense in the short run but does in the long run as the lower prices drive higher volumes, generate future economies of scale and in turn lead to further reduction in prices.
Chart 13: Costco Gross Profit Margins
Costco Gross Margin is capped at 13% by design.
Sleep recognised that the SES model applied to Amazon and committed his capital early. The Amazon strategy was articulated by Jeff Bezos in his letter to investors in 2005. We quote it in full below:
“As our shareholders know, we have made a decision to continuously and significantly lower prices for customers year after year as our efficiency and scale make it possible. This is an example of a very important decision that cannot be made in a math-based way. In fact, when we lower prices, we go against the math that we can do, which always says that the smart move is to raise prices. We have significant data related to price elasticity. With fair accuracy, we can predict that a price reduction of a certain percentage will result in an increase in units sold of a certain percentage. With rare exceptions, the volume increase in the short-term is never enough to pay for the price decease. However, our quantitative understanding of elasticity is short-term. We can estimate what a price reduction will do this week and this quarter. But we cannot numerically estimate the effect that consistently lowering prices will have on our business over five years or ten years. Our judgment is that relentlessly returning efficiency improvements and scale economies to customers in the form of lower prices creates a virtuous cycle that leads over the long-term to a much larger dollar amount of free cash flow, and thereby to a much more valuable Amazon.com. We have made similar judgments around Free Super Saver Shipping and Amazon Prime, both of which are expensive in the short term and – we believe – important and valuable in the long term.”
Nick Sleep made money because he looked very deeply at the qualitative aspects of the business model while conventional investors focused more on standard quantitative ratio analysis.
I have long believed that fundamental long-term investors should do more deep qualitative work on the business and less quantitative work. The former should be done first so that the latter is only done on those business which have attractive long- term business economics.
As Charlie Munger once said “People calculate too much and think too little.” I might explore this issue in more depth in a future essay
A more detailed look at Amazon’s business
Amazon breaks down its revenue in six segments:
Online Stores,
Physical Stores,
Third-party (3P) seller services,
Advertising services,
AWS, and
Other areas
The first four segments can be grouped together as Amazon Retail.
Online Stores
This is essentially the Amazon web store where seller is Amazon.
3P seller services
This business is when third-party merchants sell their products on Amazon Marketplace. There are over 2mn businesses who use Amazon as an online marketplace. They may also use E-Bay, Shopify and other venues.
On 3P sales third party sales, Amazon takes about 15% and makes more if the selling entity uses FBA (Fulfilled by Amazon) services. FBA services include storage, logistics and distribution. Amazon probably has a take of 30%-50% of total third party sales. The take has risen in recent years (See below)
Amazon.com Inc. is squeezing more money from the nearly 2 million small businesses that sell products on its online marketplace. For the first time, Amazon’s average cut of each sale surpassed 50% in 2022, according to a study by Marketplace Pulse, which sampled seller transactions going back to 2016.
The research firm calculated the total cost of selling on Amazon by tallying the commission on each sale, fees for warehouse storage, packing and delivery, as well as money spent to advertise on a site where hundreds of millions of products jostle for attention. Paying Amazon for logistics services and advertising is optional, but most merchants consider these a necessary part of doing business.
Amazon had a very impressive dominant position in US Retail Ecommerce as shown below:
As Chart above shows the rate at which Amazon has gained e-commerce market share has increased over time. In the last ten years they have gained share at a 4% per year and saw a big boost during the Covid-19 pandemic. Going forward the growth rate in market share is likely to slow down. Amazon currently probably has close to 50% of the e-commerce market in the USA.
Physical Stores
Amazon’s acquisition of Whole Foods in late 2017 led to fears that they were going to expand into brick and mortar retail.
Advertising
Advertising was only disclosed as separate segment in 2021. As more and more merchants have their storefronts on Amazon Marketplace, brands that want to stand out are spending heavily on ads. As a result, advertising grew very fast and became so significant that Amazon started disclosing it as a separate item.
Some senior managers at Amazon felt the ads would worsen the all-important customer experience. Bezos felt Amazon had two options: “Sell ads, and use the cash for investments. Or shun ads, and get beaten by competitors.”
There are two sources of advertising revenue: ads on Amazon Marketplace, and ads on Prime Video etc. The former account for the vast majority of advertising revenue.
Amazon offers advertisers data that is irresistible: the web shopper’s response to adverts is recorded (did they click on it and did they make a purchase?). It shows how effective every dollar spent on advertising is. Amazon also offers two and a half decades of insight on the actual buying habits of consumers, rather than just their web-browsing habits, which allows clients to more precisely target their advertisements.
“I can understand better the value of $1 spent on Amazon because I can literally see the transaction,” said Eric Heller, who runs the Amazon Center of Excellence at WPP, the world’s largest advertising agency, which advises their Clients on how best to use Amazon’s platform.
Amazon Web Services (AWS).
The story of AWS is well-known. Amazon rapidly built up a large network of Computer Server farms all over the world. The decided to rent time on the network to their customers. For the customers, it was great proposition. By moving their workflows to the Amazon Cloud, customers were
spared the often substantial upfront cost of buying their own on-premises hardware
able to transfer the infrastructure planning, maintenance and development headache to Amazon
able to adjust their exact “consumption” of infrastructure capacity according to requirements (on a hourly basis) thus avoiding the problems of both excess capacity and capacity constraints during demand peaks .
AWS was launched in 2002 bu the first mass-market product , Simple Storage Services (S3) was launched in 2006. In 2007, Andy Jassy, the current CEO of Amazon, took over the leadership of AWS. AWS grew rapidly. Amazon wisely did not break out the division’s revenues and outsiders, including competitors, did not realise how profitable AWS was. It gave Amazon a valuable 7-year head start in the Cloud hosting business. Microsoft, Google, Oracle, IBM, Alibaba and others have spent the last decade catching up.
One of the largest customers of AWS is Netflix and it grew rapidly with AWS. Netflix business would not be possible without the Cloud.
AWS revolutionized the economics of web-based business by creating a $300 billion industry, cloud computing. Every large company and most smaller ones and most organisations use some form of cloud-computing services, according to research firm IDG.
Today, most applications run in the cloud
AWS products fit into 3 buckets: Infrastructure as a Service (IaaS), Platform as a Service (PaaS), and Software as a Service (SaaS)
Some of AWS’s most popular products are EC2 (simple compute), S3 (simple storage), and RDS (a managed database).
You can read more about AWS history and impact here
Chart 14: AWS Quarterly Revenue.
The Chart above show AWS quarterly revenue growth between 2014 and 2019. It grew sharply during the pandemic and its current quarterly run-rate is US$ 21bn ( ~ US$ 84bn annually). AWS topline grew by ~U$17bn and ~U$18bn in 2021 and 2022 respectively.
Other Areas
Amazon mentions “other revenues” includes “certain licensing and distribution of video content and shipping services, and our co-branded credit card agreements”. Amazon is not very transparent in giving details on these partly because it does not want to alert competitors. Revenues in the Other Areas category are likely to be quite small but expenses may be high.
Most Recent Quarterly Results
The most recent quarterly results are summarised above.
The revenue breakdown into the segments discussed above is shown on the left .
Sales in the quarter were US$ 127.4bn ( o/w AWS was US$21.3bn or 16.7% of revenue)
Operating profit was just US$ 4.8bn (Operating margin was 3.7%)
Net profit was US$ 3.2bn .
AWS operating margin is 24% . This means the operating margin for the non-AWS business is just 0.95% (Composed of 1.2% for North America and -4.5% for International) .
Its North American marketplace, operating margin at 1.2% is much lower than the 4%+ in pre-pandemic era. Amazon believes it will get back over time as it rationalizes the cost base and enjoys faster growth with easier comps and an easier backdrop but it will take time.
The margin in international business is negative because they are investing in emerging markets . The CEO explained this point in the post-results conference call:
“I will remind you that, again, that international is an aggregation of established countries which are already profitable and who look a bit like North America, perhaps at an earlier stage of development and working their way to parity on profitability. We have forward-loaded Prime benefits in a lot of these countries that are ahead of the curve that we saw in North America. We have a large emerging business. In the last 5 years, we've added more than 10 new countries. What we're seeing is if you looked back to North America long ago, it took 9 years for us to reach breakeven profitability in the United States. We see a similar curve in a lot of countries overseas. There's, in fact, additional challenges that we usually have to deal with, things like lack of payment methods, lack of the established infrastructure for -- especially for transportation and infrastructure for the Internet and everything else.”
They are taking a characteristically long-term view in international markets and accepting that it may takes years before the non-AWS business in those markets will reach break-even profitability.
The above table was produced by MBI and interested readers can see his work on Amazon here.
Total sales grew 9.4%. The best performing segments were Advertising (+23.4%), AWS (+15.8%).
Advertising has grown at 40% CAGR in the last four years (who knew!) and now forms about 5% of revenue.
Amazon 1st party (1P) sales grew just 0.5% but 3rd Party Sales grew at 12.1%.
On AWS, the management noted that April revenue growth was sharply lower even than Q1. “… customers continue to evaluate ways to optimize their cloud spending in response to these tough economic conditions in the first quarter. And we are seeing these optimizations continue into the second quarter with April revenue growth rates about 500 basis points lower than what we saw in Q1.” This means AWS growth slowed from 16% to 11%.
Microsoft management made similar comments that customers were looking to optimise their current expenditure on the Cloud rather than increasing their commitments.
“…if you think about it, during the pandemic, it was all about new workloads and scaling workloads (on the Cloud). But pre pandemic, there was a balance between optimizations and new workloads. So what we're seeing now is the new workloads start in addition to highly intense optimization driven that we have.” Microsoft in answer to a question on the revenue slowdown in their Cloud business.
The slowdown in AWS revenue growth has been significant but Amazon believes that growth will return to this segment. As Andy Jassy noted in the conference call
“I think it’s important to remember that there’s still so much growth ahead of the cloud, 90-plus percent of the global IT spend is on-premises. And so if you believe that equation is going to flip, it’s mostly moving to the cloud”
Total sales increased 9%. Within this. North America sales increased 11% year-over-year to US$76.9 billion while international sales increased 1% year-over-year to US$29.1 billion, (would have been 8 % if one excludes FX effects- i.e. negative impact of US$ strength ).
Operating income increased to US$4.8 billion and includes approximately US$0.5 billion of charges related to estimated severance costs.
North America segment operating income was $0.9 billion,
International segment operating loss was $1.2 billion. AWS was US$5.1bn
Net income wasUS$3.2 billion in the first quarter, or US$0.31 per diluted share. It includes a pre-tax valuation loss of $0.5 billion on its stake in Rivian Automotive, Inc.
Operating cash flow increased 38% to $54.3 billion for the trailing twelve months, compared with $39.3 billion for the trailing twelve months ended March 31, 2022.
Free cash flow improved to an outflow of US$3.3 billion for the trailing twelve months, compared with an outflow of US$18.6 billion for the trailing twelve months ended March 31, 2022.
Other issues
As with other large tech players this quarter, most of the CEO’s comments were focused on A.I. They believe their capabilities in A.I. will drive AWS revenues. Clients will want to do heavyweight AI model training on the cloud. Amazon has invested heavily in a custom ML training chip set (Trainium) and hopes this will enable clients to train large language models (LLM) more cheaply and with more scale than competitors (Nvidia ?). Amazon has also been working on a custom chip for AI Inferencing (Inferentia).
“The combination of price and performance you get from our chips is differentiated and very significant. We think that a lot of the ML training and inference will run on AWS.” CEO Andy Jassy
Amazon is now working on a generative AI tool called “CodeWhisperer” which automates code creation to speed up expedite application building.
Amazon sees itself as one of the few companies making the investments to build a foundational set of models to build on top of. It intuitively calls this foundation “Bedrock.”
Bedrock is how developers can pull from Amazon’s base models to customize on top of for more specific use cases. It’s how Amazon hopes to build standardized tools for customers as AI use cases explode.
Amazon believes the trend to ML and AI will greatly boost AWS.
“..a lot of folks that don’t realize the amount of non-consumption right now that’s going to happen and be spent in the cloud with the advent of Large Language Models and generative AI. I think so many customer experiences are going to be reinvented and invented that haven’t existed before. And that’s all going to be spent in my opinion, on the cloud. “ Andy Jassy , CEO, Amazon Inc.
They mentioned that the 2023 Capital Expenditure will be less than the US$ 60bn seen in 2022 and the mix will switch towards Large Language Models and AI.
Concluding Remarks
Amazon is on the most remarkable companies on the planet. It has consistently followed its sales growth focused strategy. and increased sales 100x in ~20 years to current run rate of about US$ 52 bn.
It started of a seller books but expanded into selling everything else.
It created a Marketplace where 2mn sellers vie to sell to hundreds of millions of online customers who pay to get featured on Amazons website where many hundreds of millions of customers are to be found. Sellers can choose to use Amazons fulfillment capability (FBA) which allows Amazon to increase its take.
AWS, the Cloud hosting business was stated 20 years ago. It has been a fast growing high-margin segment which now accounts for 21% of revenues and an estimated 75%-80% of operating profit.
Although sales have grown strongly, margins and operating cashflow remain low. As the company has consistently invested for future growth, free cash flow has been low.
The company’s shares have consistently traded at 2 X sales and the share price has moved in line with sales even though the stock has consistently looked expensive on conventional valuations.
E-commerce and Amazon got a huge boost during the Covid-19 pandemic. Amazon 2022 sales were were more than double 2018 sales. Amazon responded to the pandemic boost in sales by a huge increase in fulfillment capacity (Capex was US$ 60bn in December 2021 and 2022- see chart below) and a last mile network which is estimated to be double the size of UPS.
Chart 14: Amazon Annual capital Expenditure.
However, sales growth is likely to slow. It is likely that online sales will grow more slowly as the Pandemic boost fades.
AWS sales growth fell to just 11% in April (Microsoft in their conference call implied that Azure growth in April 2023 was 25%) o this segment seems set to see slowing growth for the foreseeable future too
3P sales and advertising have been growing strongly. However, the latter is slowing and the former though growing impressively, is currently too small to move the needle.
Closing Thoughts
Amazon is seeing slower growth in retail and a distinct slowdown in the AWS which accounts of 17% of revenue and 75% of operating profit. Microsoft’s Azure cloud business looks set to grow much faster than AWS for the foreseeable future.
The company has implied it will take some years for the margins in the core retail business to go back to the pre-pandemic levels.
The company is committed to making large investments in ML and AI in the next few years. This will reduce Free Cash Flow for some time.
Amazon believes they will be well-placed to capture the new ML/ AI business that will be conducted in the Cloud. However, Microsoft and Google are now big players in Cloud and many have some strong advantages in ML/AI.
Amazon is a like a perpetual investment and growth machine. The next few years will see an investment phase while growth is likely to be moderate.
Beyond that, Amazon believe that there will be a significant growth in Cloud AWS.
Amazon claims 90% of current IT infrastructure is still physically located on premises and believe that much of this will migrate to the Cloud.
There will eventually be an explosion in ML/ AI work and this will be done on the Cloud. Amazon believe they will eventually be well placed to capture this business
We do not see any compelling reason to buy Amazon at this juncture and are adopting “a wait and see attitude”. At a forward P/E of 57 times, Amazon is less attractive than our current holding of Microsoft which we discussed here and is on a forward P/E of just 29 times.
We risk making the same mistake we made, in the early and mid 2000s when we did not buy the stock and Nick Sleep compounded impressive gains.
While we are waiting and, if time permits, we will re-read Nick Sleep’s ideas on Scale Economies Shared and see if we can apply this it Amazon and whether it gives us more compelling reasons to invest.


