Morgan Stanley (MS)
We wrote out first report on a financial institution (JP Morgan) which can be seen here.
We will also look at Morgan Stanley (MS) in the current reporting season. This note considers the history of the MS before describing the current business profile and analysing the most recent quarterly results.
Introduction
After the Great Crash of 1929, America passed the Glass-Steagall Act and this forced banks to divest their trading operations. Banks were not allowed to participate in securities trading while securities firms were not allowed to lend. JP Morgan had to exit securities trading and Morgan Stanley was born.
For decades, it was seen as the most elite blue-blood firm on Wall Street, a trusted adviser to the most prestigious companies and institutions. Unlike the upstarts like Salomon Brothers, Goldman Sachs and Bear Stearns, they were not aggressive traders. Their business model was like Lazard Inc. today.
However, the “upstarts” showed the profits that could be made from trading. From the 1960s, onwards MS stepped up its trading activities and has become one of the leading market intermediaries and traders. As trading activities grew in the last six decades, MS grew rapidly expanded its global footprint.
MS started its Prime Brokerage business in 1984. In 1986, MS ceased to be a partnership and was listed. Goldman Sachs was not listed in 1999.
In 1997, MS merged with Dean Witter which had a retail brokerage business.
During the 2008 market crash, Morgan Stanley and seven other large U.S. banks received capital investment through the Troubled Asset Relief Program (TARP). MS paid back TARP money by 2009.
After the global financial crisis, Mitsubishi UFJ Financial Group (MUFG) of Japan had a 23.3% stake in MS, which it still hold today. The stake is worth $40bn and accounts for 35% of the value of MUFG.
In 2020 and 2021, MS acquired E-Trade, an online retail brokerage (a $ 13bn acquisition) and Eaton Vance (an institutional asset manager).
Today MS is one of the largest financial services companies globally. Their reporting segments are shown below. For more information on the history of the company please see here.
Institutional Securities (IS) business segment provides investment banking, sales and trading, and other services to corporations, governments and financial institutions. IS is the Investment Bank which MS is best known for.
Wealth Management (WM) business segment provides an array of financial services and solutions to individual investors and small-to-medium sized businesses and institutions. Activities include
brokerage and investment advisory services
market-making activities in fixed income securities
financial and wealth planning services, credit and other lending products,
banking and retirement plan services.
Investment Management (IM) business segment provides a range of investment strategies and products for many large institutions and organisations. IM accounts for less than 10% of revenues.
The capital-intensive Institutional Securities (IS) accounts for 48% of revenues. IS Securities profits are inherently volatile as the revenues are highly cyclical while costs are fixed and only tend to rise over time.
The company has pivoted to less capital-intensive businesses such as WM and IM over time. The latter have a less volatile earnings profile than IS. The decades-long investment in WM/IM is paying off with more than 50 % of net profits are derived from such businesses.
MS remains a North America-focused company as it sources three quarters of its revenues there.
Americas 73%
EMEA 14.6%
APAC 12.4%
The 1933 Glass-Steagall Act was repealed in 1999. This was the culmination of lobbying by the big commercial banks who wanted to enter Investment Banking in a unfettered way.
In 2008, MS became a bank holding company. This allowed it access to deposits and funding through the Federal Reserve Bank Discount Window, as well as low-interest loans from the Fed- a useful tool in the Global Financial Crisis in 2009. The change also allowed MS to use deposits to lend, which became a bigger focus for the company.
However, MS is much less of commercial bank compared to JP Morgan (JPM) which has many retail branches and extensive wholesale commercial banking operations. JPM’s balance sheet is $3trn compared with just $1trn for MS.
As a bank, MS is subject to all regulatory capital rules applied by the New York Fed who are its consolidated (apex) supervisor. As a complex financial institution with many subsidiaries, MS subject to many other regulators (SEC, CFTC, CFPB etc) and regulatory regimes both in the USA and globally.
As of December 2023, Morgan Stanley had 80,000 employees in 42 countries. Of these, 53k are in the USA, 17k in Asia and 10k in EMEA.
We can look at a few charts to get an idea of the scope of the company.
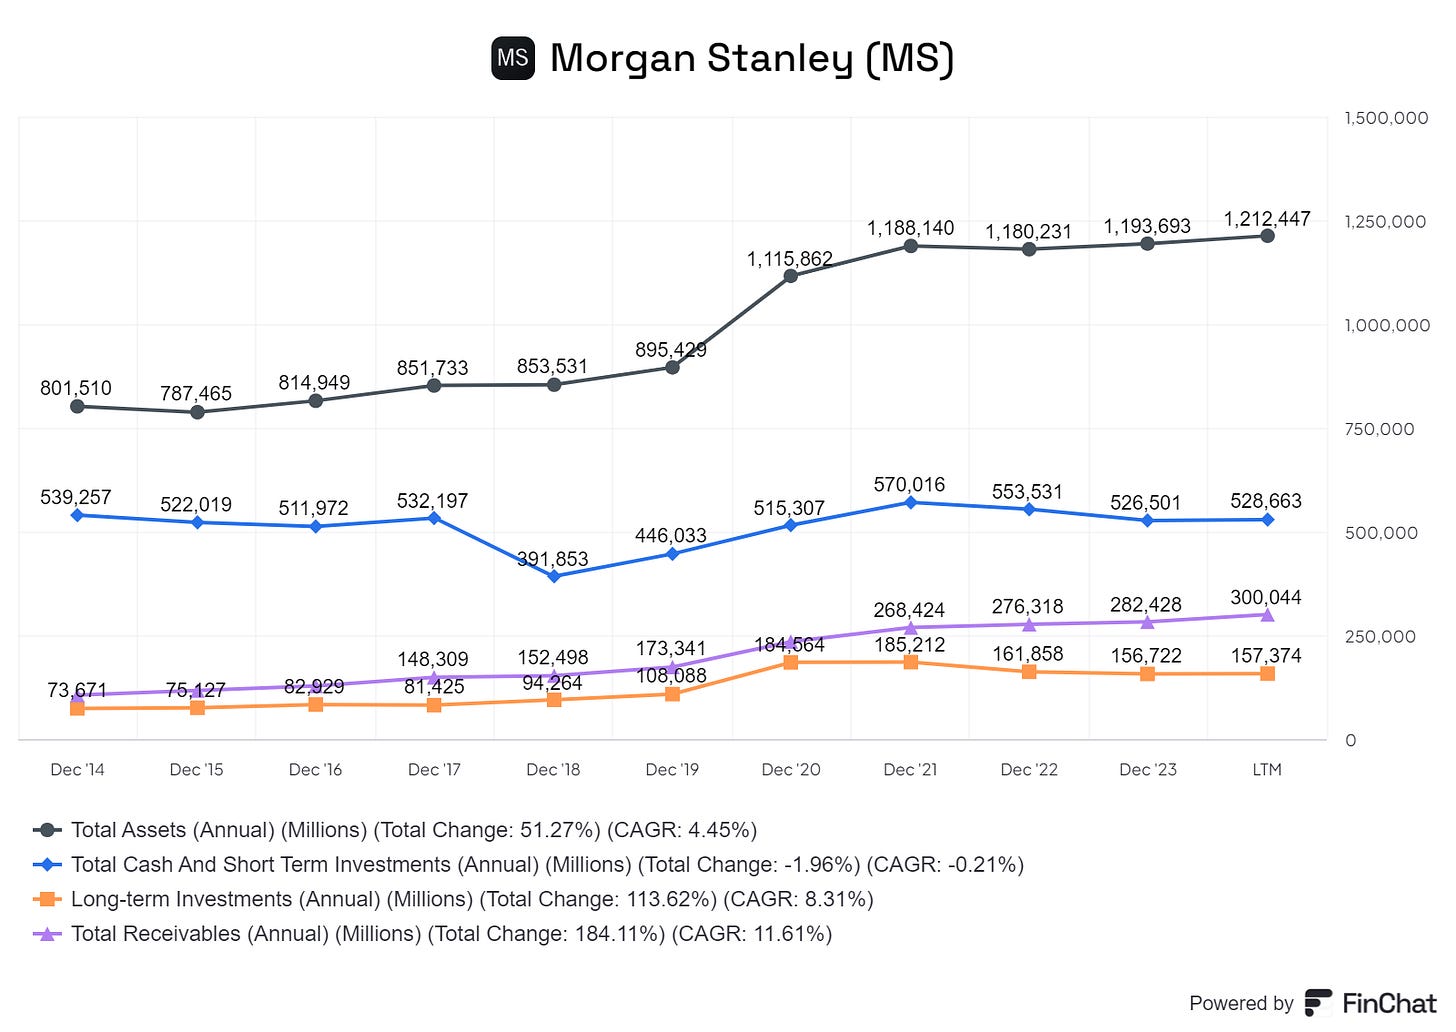
The total assets are $1.2trn. There was a big jump in 2020 after the acquisition of the retail brokerage E-trade. The latter has $ 360bn of assets at the time of acquisition.
It is worth looking at the balance sheet of MS to understand the differences with a large commercial bank such as JPM.
MS Balance Sheet – selected assets.
Of the ~$1.2trn in assets, $528bn is cash and short-term assets and receivables are $300bn and long-term investments are $157bn. It is a relatively liquid asset book. This is very different from a commercial bank, is mainly involved in maturity transformation in its banking book by borrowing short and lending long.
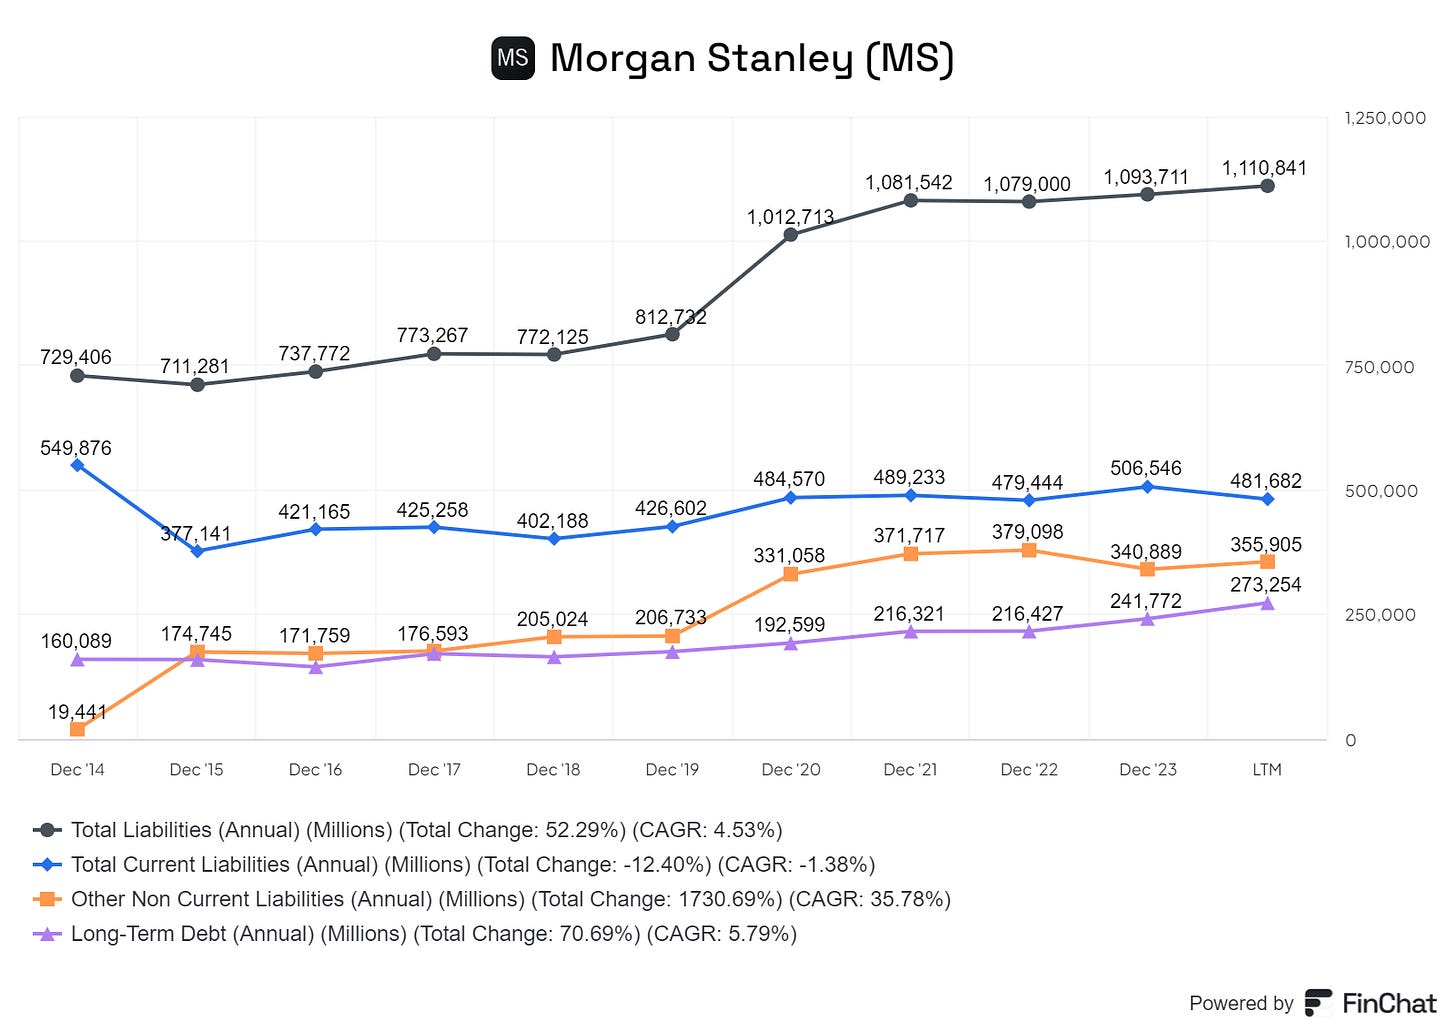
MS Balance Sheet- selected liabilities .
Of the total non-equity liabilities of ~$1.1trn, $481bn is current liabilities. This suggests that running a securities business is essentially managing short term assets and liabilities.
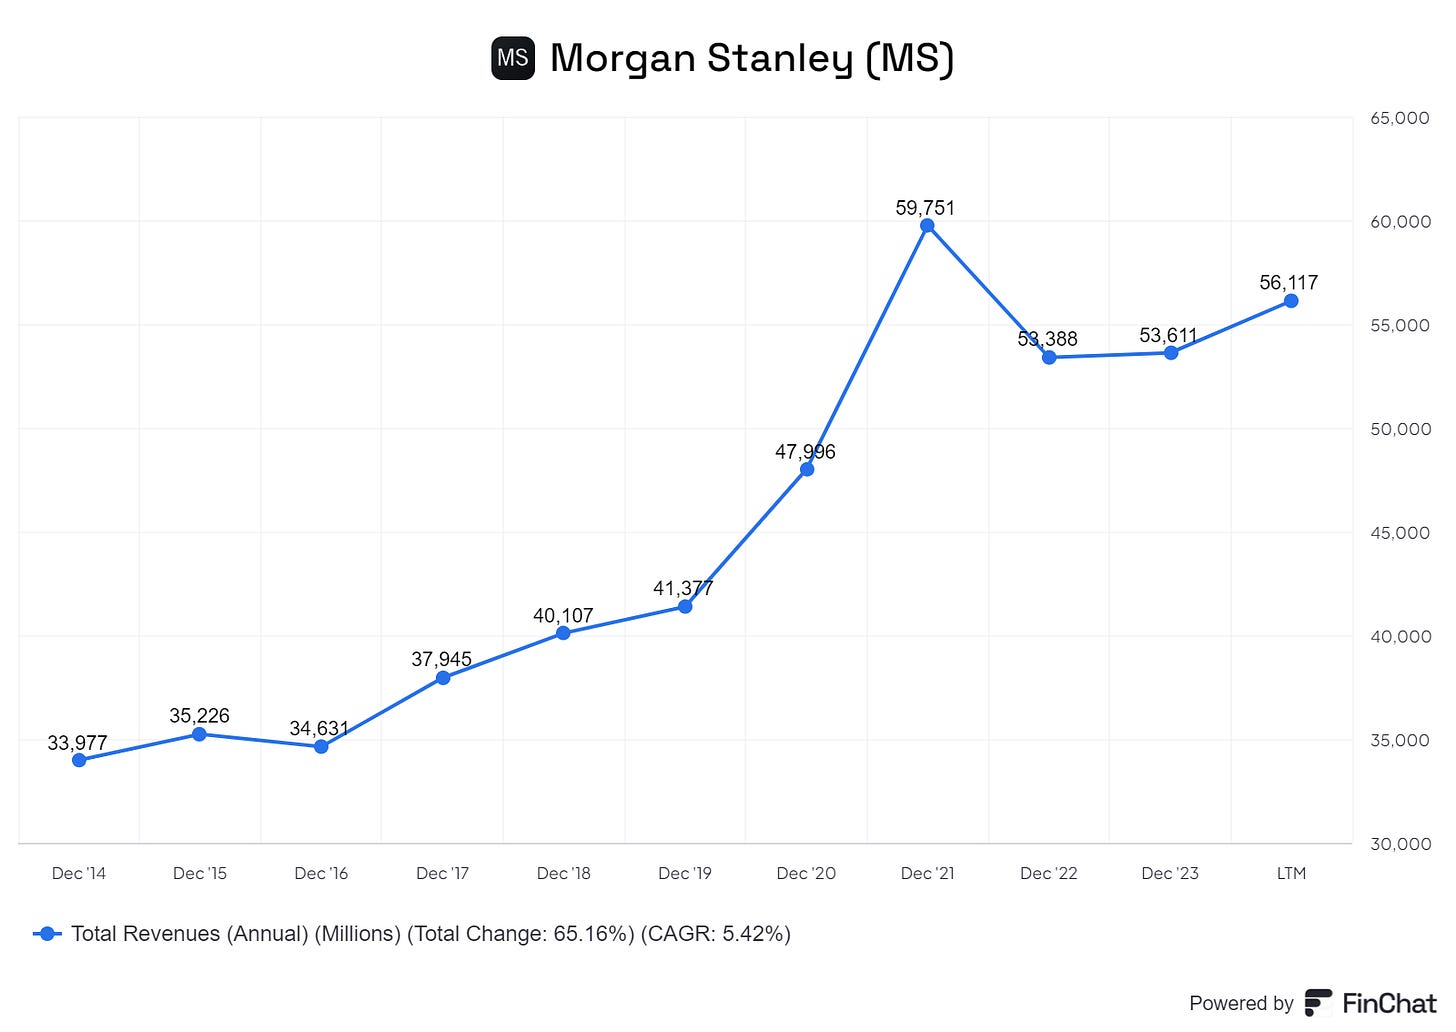
Revenues
Operating Profits
MS Revenues and Profits peaked in 2021 and have declined a little since. Operating profits have been volatile and were $16.3bn in 2023.
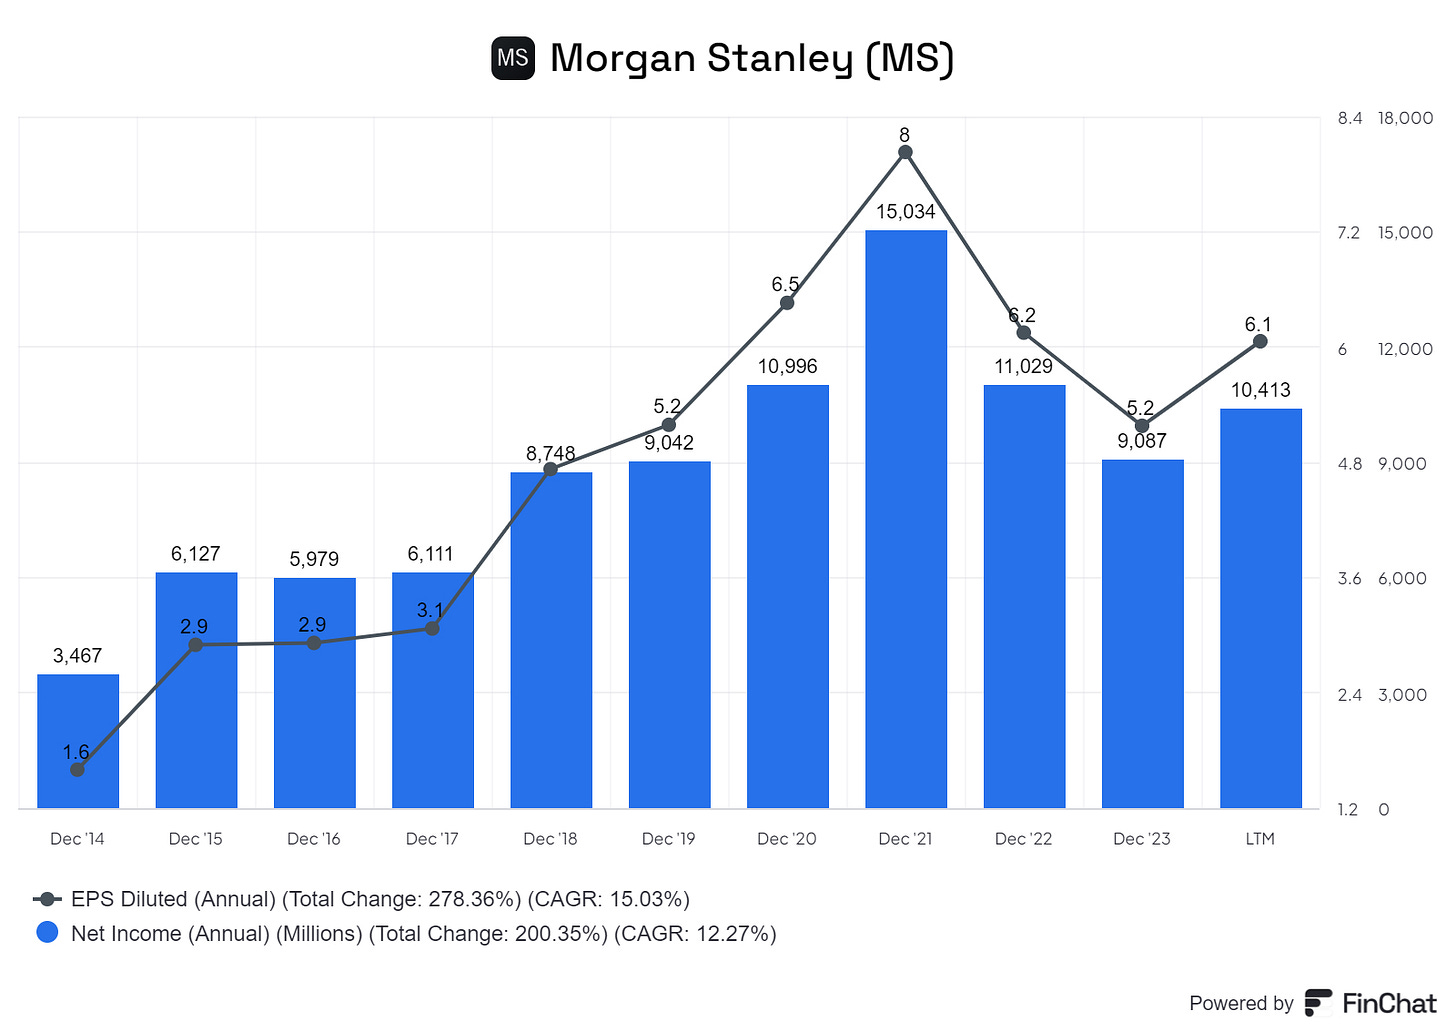
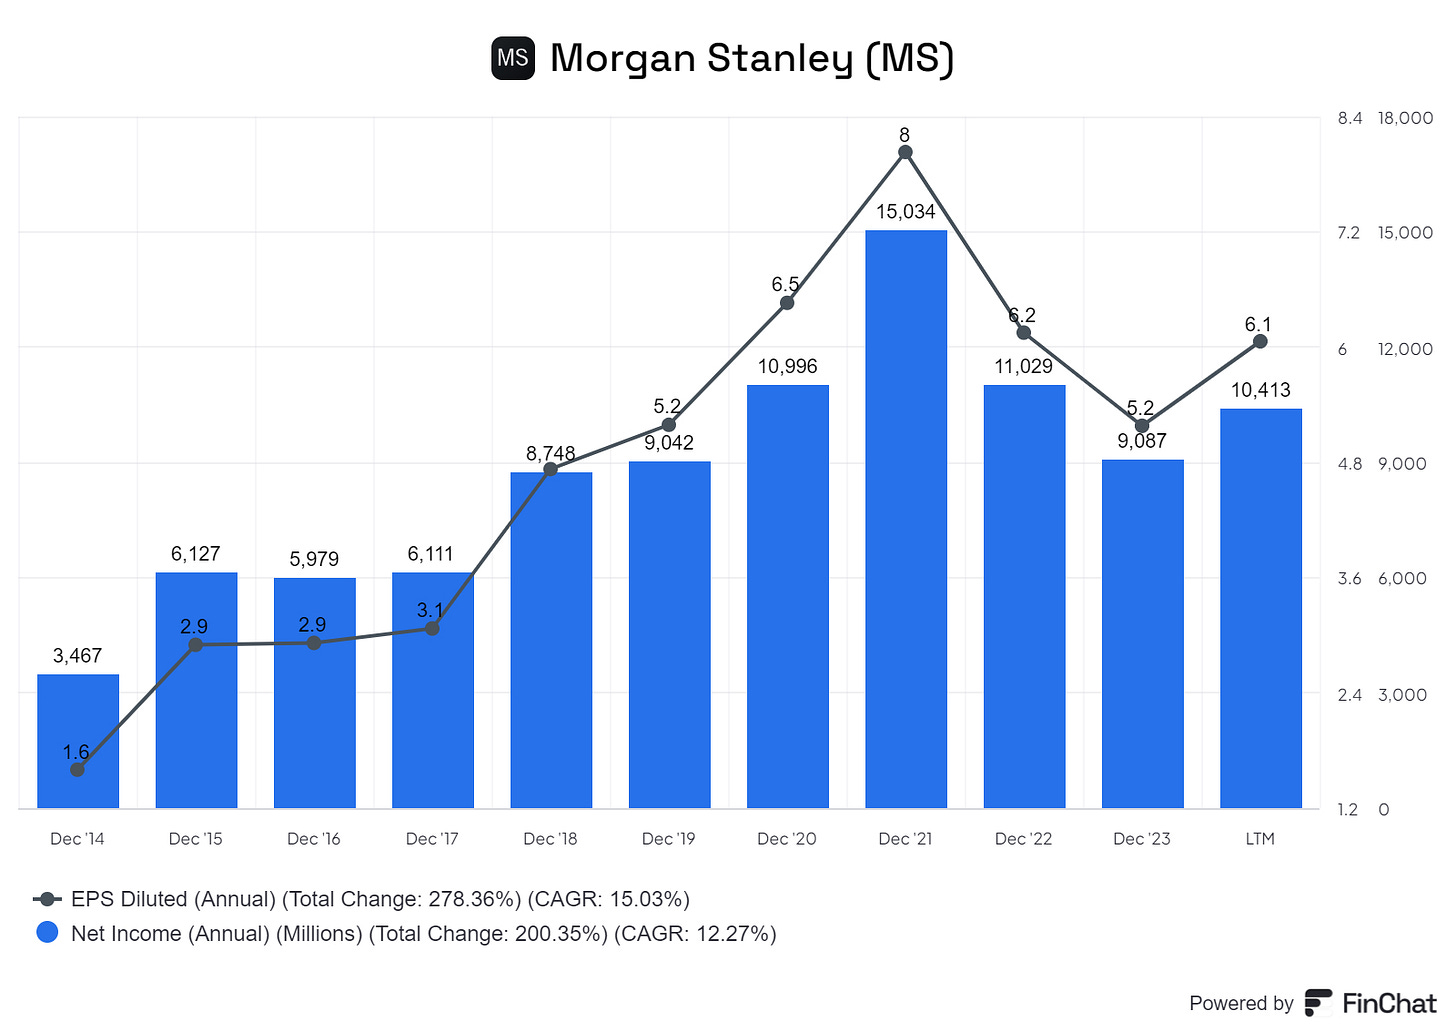
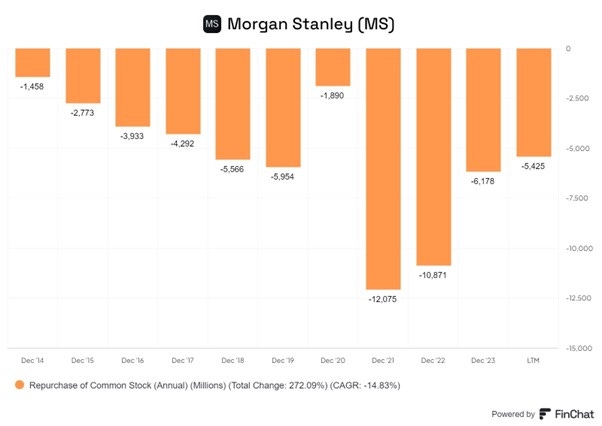
The Chart above shows Net Profit and EPS growth. The latter is boosted by the ~1% net reduction in shares outstanding per annum due to share repurchases. See the chart below for share repurchases. The figures are shown as negative as they represent a cash outflow.
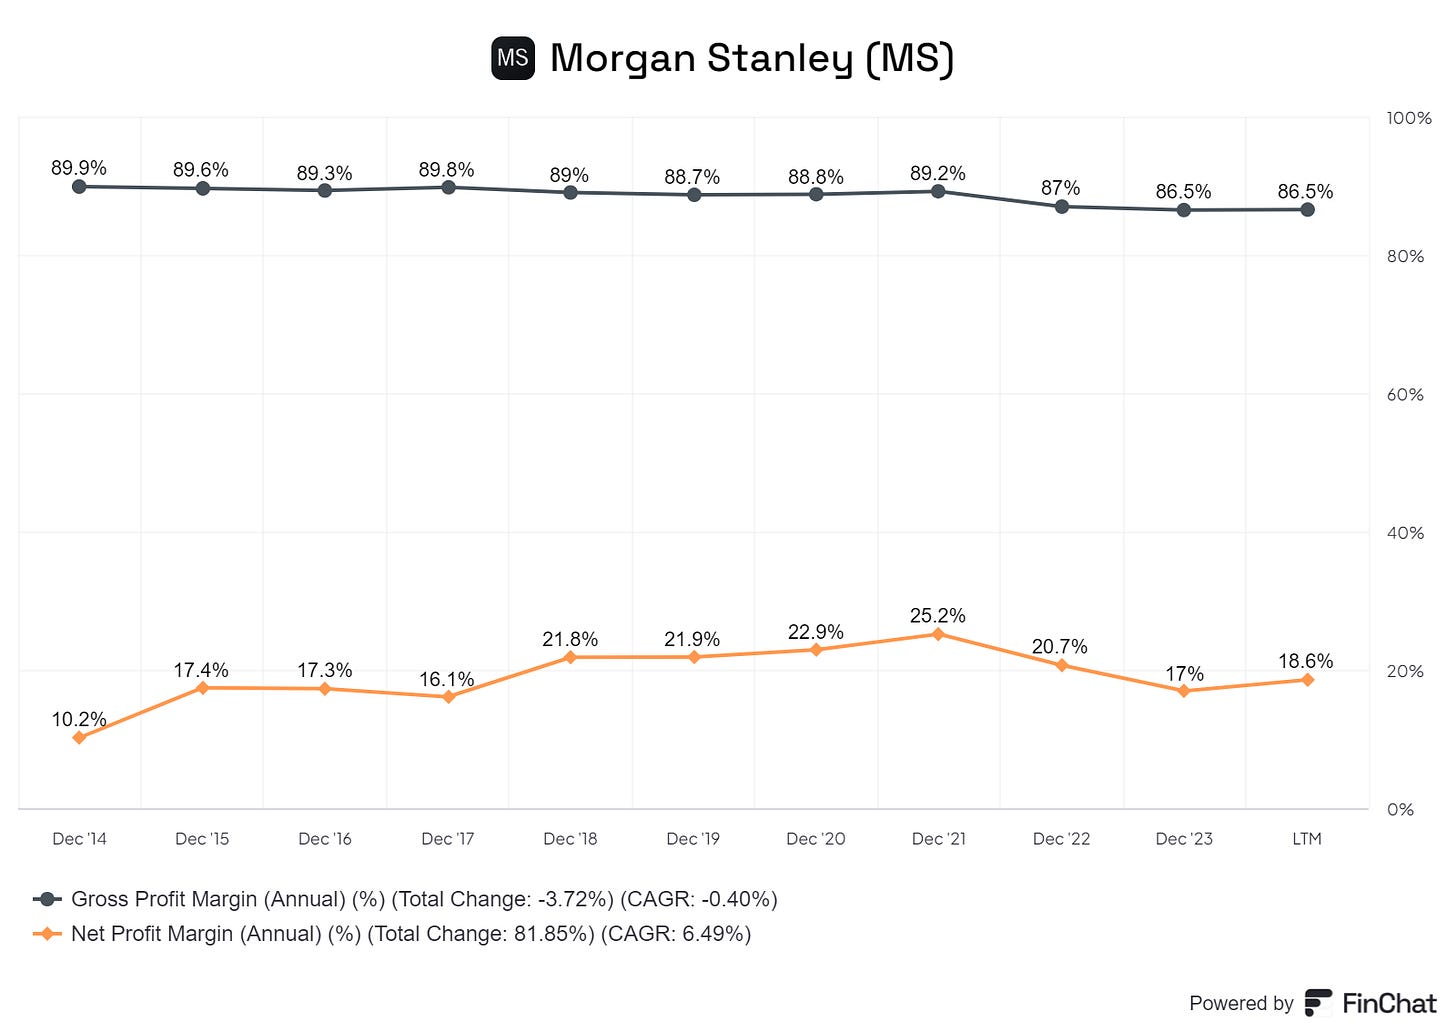
Gross margins are ~86% while Net Margins are ~ 18%. The difference reflects high operating expenses especially compensation. The Expense Ratio is high ~72%% which translates to a pre-tax margin of ~27% (100% -72%)
WM pre-tax margins are much more stable than IS pre-tax margins.
Profitability
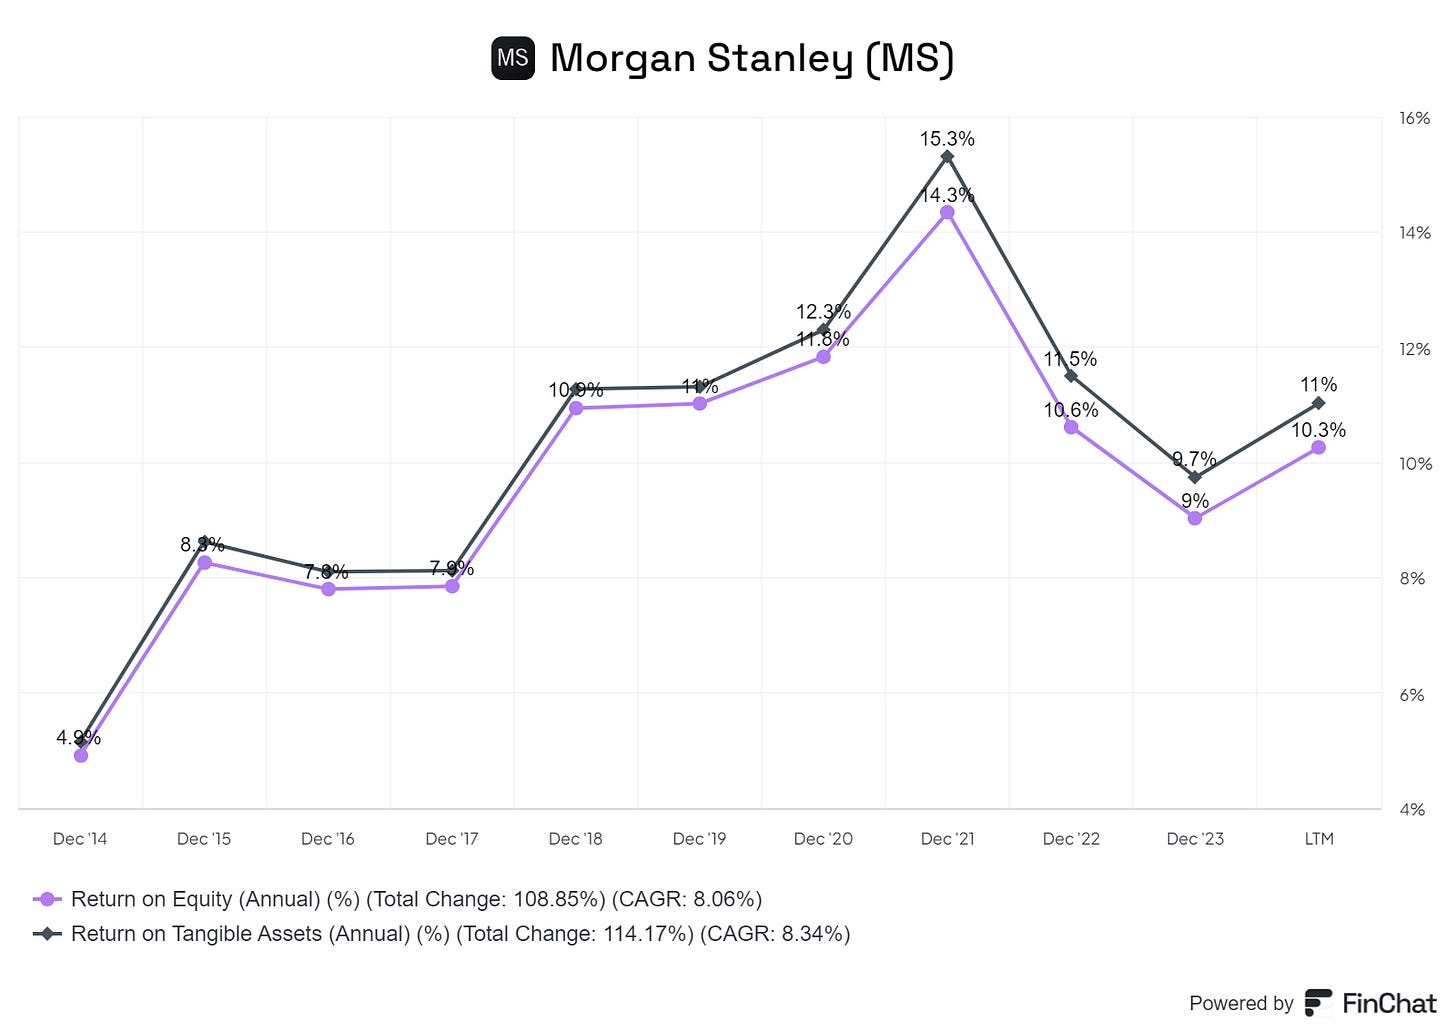
Profitability is in the range 10%-15%.
The ROE for the firm in Q2 was 13%. ROE in WM at 19% is higher than in IS and is also less volatile: in 2023, IS ROE slumped to 7%.
A slightly different picture emerges if we look at ROTCE which is Return on Average Tangible Equity – this is a non-GAAP metric that Morgan Stanley uses to evaluate its operating performance and capital adequacy. It is calculated by dividing net income minus preferred dividends by average tangible common equity.
The denominator is essentially common equity minus goodwill and intangible assets.
In January 2022, Morgan Stanley's CEO, James Gorman, raised the bank's long-term ROTCE target from 17% to at least 20%, citing the earnings potential of their business model. In 2023, it was just 9.4%.
As a numerical matter, the path to ROTCE of 20% is clear. WM and IM have to be expanded while the all-powerful IS business has to be scaled back. The transformation is unlikely to be achieved for reasons we will consider later.
Shareholder Returns
In the last 5 years the stock had a CAGR return of 24%.
In the last 10 years, the CAGR return was 14.9%.
In the last 30 years, the CAGR return was 11.1%. This is broadly the return on the S&P 500 Index.
We often see this - the long-term CAGR return is not much different from the profitability of the business, as measured by average long-term ROE.
We recall Charlie Munger’s comment on ROE.
"Over the long term, it's hard for a stock to earn a much better return than the business which underlies it earns. If the business earns 6% on capital over 40 years and you hold it for that 40 years, you're not going to make much different than a 6% return—even if you originally buy it at a huge discount. Conversely, if a business earns 18% on capital over 20 or 30 years, even if you pay an expensive looking price, you'll end up with a fine result."
In our view, this is a very important observation. It suggests that for long-term investors, the difficult task is to find those very rare companies that can fight off competition and achieve high ROE over long periods of time. If you do find a few such rare companies, you should not be aggressive on the target entry valuation. In any case, such companies are unlikely to trade on a low valuation except during periods of intense market distress.
A detailed look at the MS business numbers.
Total Revenues in 2023 were $53.6bn. Of this $47bn was operating revenue while $8.8bn was interest income.
Breakdown of Operating Revenues
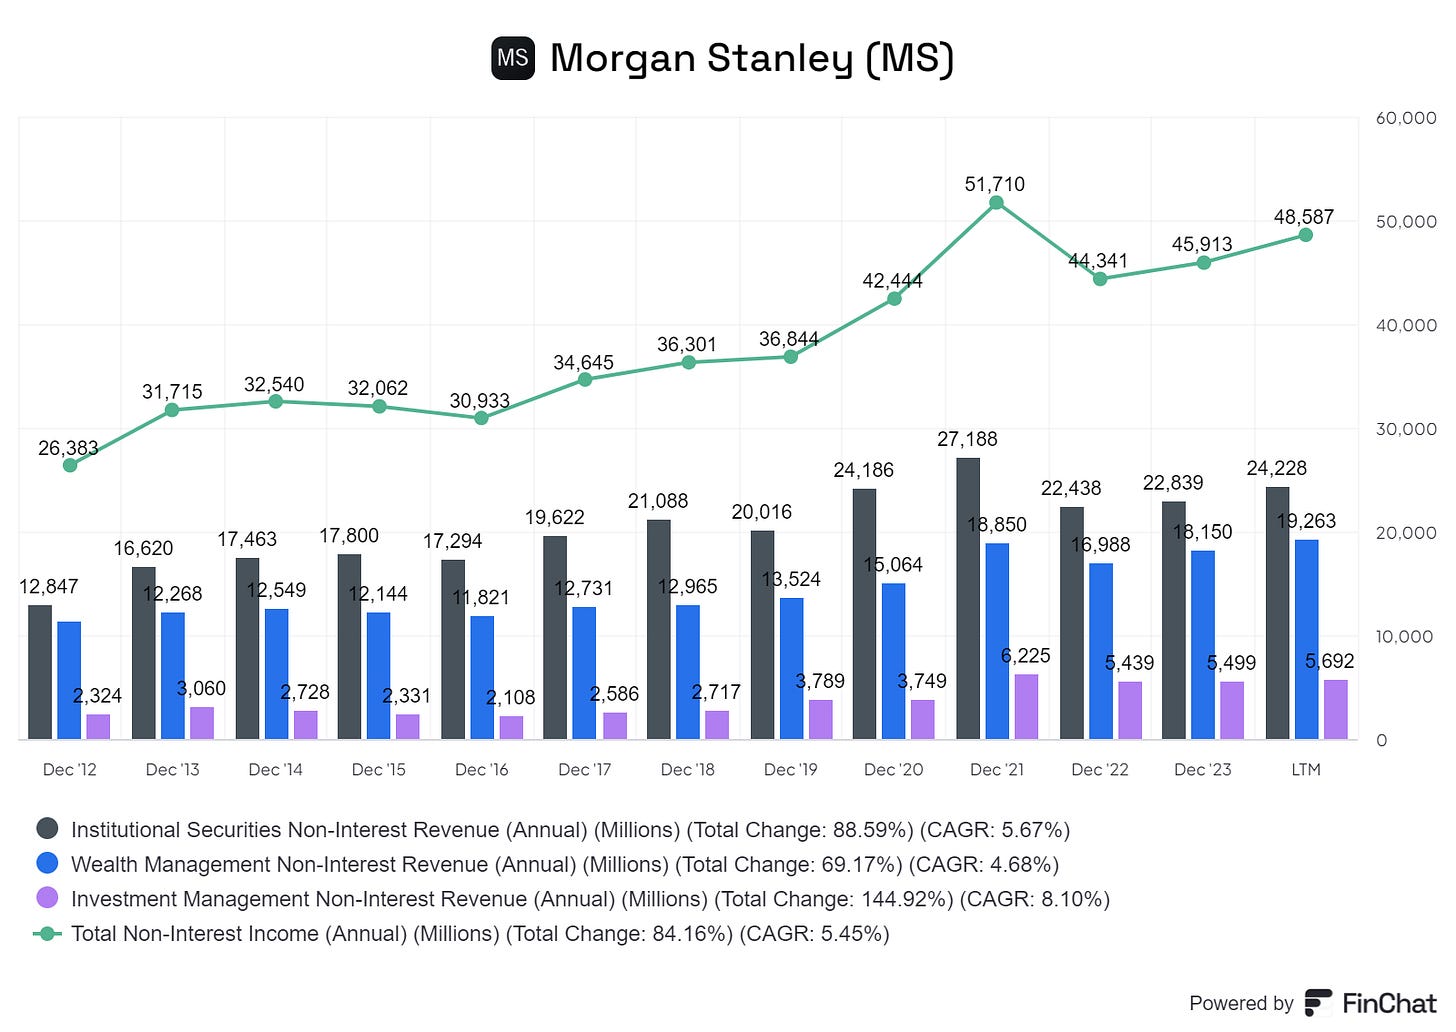
The chart below shows the breakdown of the 2023 operating revenues by business division. IS is the largest contributor, but it is more volatile than WM.
2023 interest income was $7.4bn. More than 95% was generated in Wealth Management due to the spread on lending out WM client balances. This business was boosted by the acquisition of E-trade.
The chart below shows Net Profit and EPS. The later has been boosted by share buybacks. Net profits have grown strongly in the last ten years.
Shares outstanding grew in 2021 due to the acquisitions of E-trade and Eaton Vance but have been declining steadily since then.
Detailed Breakdown of the business Segments
Let us consider the three segments as standalone business.
Institutional Securities business
IS consists of Investment Banking (IB) and Markets.
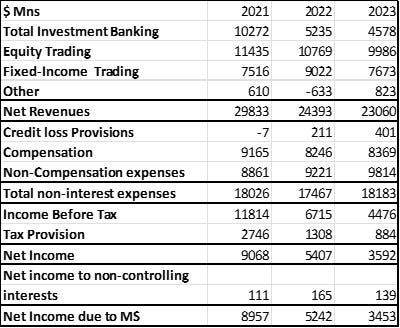
IB consists of advisory and new issue or primary markets underwriting (both Equity and Fixed-Income). IB generated revenues of $ 10.2b in 2021 but this had fallen to $ 4.6bn in 2023.
Markets is the secondary markets business in Equity and Fixed-Income covering both cash and derivatives. In 2022, Equity Trading Revenues were ~$ 10bn while Fixed-Income Trading Revenues were ~$ 7.7bn. These are large businesses.
IS net profit declined from $8.9bn in 2021 to $3.4bn in 2023. This was due to a halving in IB revenues which itself was driven by a collapse in Equity Primary underwriting. These numbers show the volatility of IS net profits.
It should be noted the fall in IS revenues of % (~$ 29bn to ~$23bn) was not accompanied by a meaningful fall in compensation. This shows that costs are fixed and not variable and this means IS profits will always be volatile. People defending “bankers’ bonuses” say pay is for performance and varies with it but this data suggests that this is not the case.
Wealth Management
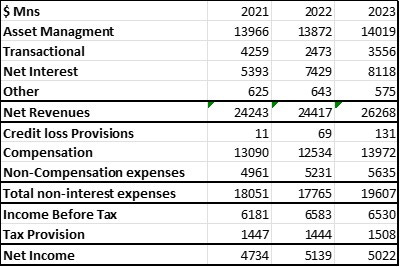
WM is a more stable business, and its net profit rose from $4.7bn in 2021 to $5bn in 2023. In 2023, WM net profit was higher than IS net profit ($5bn vs $3.4bn).
Investment Management (IM)
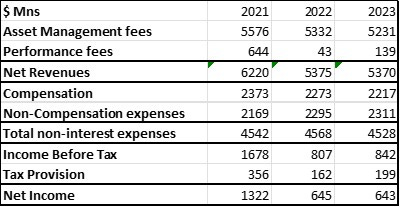
IM is a much smaller business and seems to be facing revenue challenges.
Regulatory Capital
In our note on JPM (which can be found here), we described the framework which determines how much regulatory capital banks must hold. We reproduce the relevant section below.
In the last forty years starting in 1988, global regulators have developed a series of standards of global minimum standards of capital adequacy which were known as the Basle Accords.
These stated that all banks had to have a minimum amount of loss bearing or risk capital as a percentage of risk weighted assets (RWA). The global minimum was set at 8% but local bank regulators were expected to insist on additional buffers.
Additional buffers have been added over time in response to crises affecting the banking world.
These capital requirements were not enough to prevent the global financial crisis of 2009 when banks failed globally, and taxpayers were forced to bail them out. Equity holders in many cases had 100% losses. The GFC led to even more numerous and more stringent regulations.
Basel III is a set of measures developed by the Basel Committee in the years following the global financial crisis of 2007-09. The measures, rolled out over several years, aim to strengthen the regulation, supervision, and risk management of banks. The final set of rules has been dubbed the “Basel III Endgame.” These rules focus on the amount of capital that banks must have against the credit, operational, and market riskiness of their business. In July 2023, the Fed, OCC, and FDIC published for comment proposed changes to bank capital rules in the U.S. that are intended to be aligned with the Basel III standards. The Basel III capital requirements will be determined by the end of 2024. There is more on the Basle regime here.
Capital Buffers
Capital buffers are the additional regulatory capital required over and above the minimum 8%. Buffers are expressed as a percentage of Risk Weighted Assets (RWA).
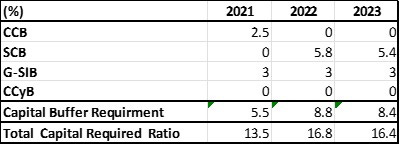
For MS, the four relevant buffers are shown below
CCB is the Counter Cyclical Buffer which regulators require during times of plenty for the time when the inevitable downturns come. The CCB was set at 2.5% in 2021 but was replaced by the SCB in 2022.
SCB is the Stress Capital Buffer. The Federal Reserve conducts stress tests annually and uses these to determine the SCB. Stress tests simulate a period of market distress and dislocation to see the impact on capital. In 2022 the SCB was set at 5.8% for MS and for 2023 it was lowered to at 5.4%
G-SIB means Globally Systematically Important Banks. These are institutions deemed so vital to the global economy that regulators fear their failure could trigger a systemic financial crisis. Identified by their size, complexity, and economic connections, G-SIBs are closely watched by regulators. Morgan Stanley is a G-SIB and subject to the 3% G-SIB buffer.
CCyB which is a counter cyclical buffer. This can be as high as 2.5% but is currently set at 0% by the Fed.
For MS in 2023, the sum of the capital buffers is 8.4% and the total regulatory capital requirement is 16.4%. This will change in 2025 at the “Basel Endgame” is completed.
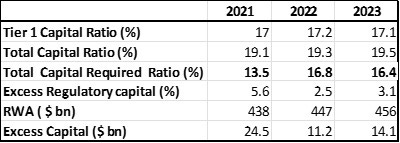
In 2023, MS’s actual regulatory capital ratio was 19.5% and therefore excess was 3.1% or $14bn. Therefore, MS can return up to $14bn to shareholders in share buybacks and dividends.
Lowering the regulatory capital requirement is clearly in the interest of shareholders. How can large banks reduce it?
They can lobby regulators and legislators to reduce the capital requirements. Banks are indeed large spenders on lobbyists. This is not surprising as there are billions at stake.
The other way to reduce the capital burden is to de-risk the business and reduce the RWA.
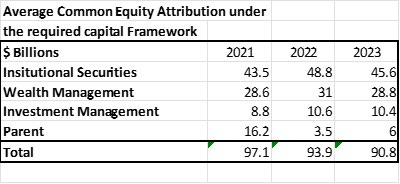
MS provide an estimate of their attribution of available equity capital across various business. 50% of the capital is allocated to the IS business.
MS’s capital requirement can be reduced significantly by scaling back the IS business in absolute terms. This will work in two ways: first by reducing the RWA and by a likely consequential reduction in the SCB as well.
Highlights of the most recent quarterly conference call
General Points
We noted above that operating leverage will kick in meaningfully if there is a strong boost to revenues in the IS segment. 2024 so far has been a strong year for IS.
For the first half of 2024, they generated “$30bn in revenue, $6bn in earnings, and an 18.6% return on capital.”
“Wealth and institutional securities produced $6.8bn and $7bn in revenue respectively”
Comments on Institutional Securities (IS).
In IS, we're beginning to see the benefits from our continued focus on our world-class investment banking franchise, with revenues up 50% year-over-year, including a 70% increase year-over-year in fixed income underwriting.
“In institutional equities, we are back with a $3 billion quarter.”
“Institutional securities net revenues of $7 billion increased 23% versus last year, capturing the strengths of the integrated investment bank across US, and international markets. Higher activity in Asia contributed to results.”
The operating leverage is shown here- a 23% increase in net revenue led to a 95% increase in income before tax.
“Investment banking revenues were $1.6bn. The 51% increase from the prior year was broad-based.”
The investment banking backdrop continues to improve, led by the US, the advisory and underwriting pipelines are healthy across regions and sectors.
“Equity revenues of over $3bn, up 18% compared to last year, reflect strong results across business and regions.”
“Fixed income revenues of $2bn increased year-over-year.”
Comments on Wealth Management (WM)
“Across wealth and investment management, we've now grown total client assets to $7.2trn on our road to $10trn plus.”
“Year-to-date, annualized growth in net new assets and wealth management is over 5%, with another strong quarter of over $25bn in fee-based flows.”
“Wealth management also delivered on our established strategy, reporting record durable asset management fees and strong fee-based flows. Together, improved confidence and higher client engagement along with our focus on prioritizing investments, yielded operating leverage, and profitability.”
“Wealth Management client assets reached $5.7trn. Pretax profit was $1.8bn up year-over-year with a reported margin of 26.8%.”
The (higher) margin demonstrates the inherent operating leverage of our asset gathering strategy.
“The Wealth Management business continued to perform well, aggregating assets, generating fees and benefiting from scale and our differentiated offering, consistently earning approximately $100 million a day.
“Our Wealth Management strategy is predicated on gathering assets, meeting our clients' lending needs and offering advice. Asset management fees, the core of our Wealth Management strategy, continues to produce strong results reaching a record this quarter. Taken together, we delivered a strong margin, and we continue to work towards 30% margins over time.”
Comments on IM
“Turning to Investment Management. Revenues of $1.4bn increased 8% from the prior second quarter, supported by higher asset management revenue. Total AUM ended the quarter at $1.5trn.”
“We recorded long-term net outflows of approximately $1 billion.”
Comments on the Outlook for MS
“Having generated an 18.6% ROTCE year-to-date, we enter the back half of the year from a position of strength, with a robust capital base to support clients.”
“Investment Banking pipelines are healthy and diverse, dialogues are active and markets are open.”
“In January, I had said 30% was the goal (for pre-tax margin). We just printed 27%. It's a core stated objective. It will take some quarters to get there, but we intend on achieving it over time as we continue to grow assets and scale in the business.
“We can now expect broader corporate finance activity to quicken, whether that is across the corporate community or sponsors or other institutions.”
Global convertibles activity is up significantly. And as you know, on the margin ladder, it typically goes converts, IPO, and then M&A.
We've been seeing now the launch of traditional IPOs and we are seeing M&A pipeline kicking in.
“We are seeing some real operating leverage in the Investment Bank. And over the course of a number of years, as we think about not just the integrated firm, but the returns generated inside of Wealth and Investment Management.
Summary
Morgan Stanley is one of the largest global financial institutions. It has a 90-year history.
It has particular strengths in Investment Banking and Equity Markets.
It has a large and significant Wealth Management business.
The investment bank accounts for about 48% of revenues. IS’s contributions to net income varies a lot as its earnings are volatile.
This volatility means there is a cap on the valuation multiples for Morgan Stanley.
From a shareholders’ point of view, it is clear what Morgan Stanley should do. They should grow the Wealth Management business and shrink the investment banks drastically. This would have the following beneficial effects.
A reduction in the volatility of earnings which would lead to the shares trading at much higher multiples
An increase in the profitability of the company
A reduction in the regulatory capital requirement allowing billions of dollars of excess capital to be paid out to shareholders.
MS has a ROTCE target of 20%. In the most recent quarter with the upturn in the Investment Banking Cycle, they achieved 18.6%. This may exceed 20% for some time but given the cyclicality of the IS business, it is unlikely to achieve the 20% target ROTCE over a sustained period.
The Investment Bank should be shrunk but this will not happen. The MS senior management is made up of Investment Bankers and it is the most powerful division within the organisation and the source of that power is money
Investment banking is a particularly stark example of the Principle/ Agent problem. The interest of the management and the shareholders are not aligned.
The shareholders’ interest are served by long-term growth in profit and cash flow at high rates of return. The employees’ interest are driven by short term compensation though they may also own significant equity.
We saw that compensation is very high (expense ratio of ~70%) and is a fixed rather than variable cost.
The management’s most powerful incentive is to maximise revenues and spend 70% of it. Management are also incentivised to maximise the share of that 70% that is accounted for by compensation.
In the last 30 years, MS shareholders have got a return of 11% CAGR which is in line with the S&P 500. They have not seen any Alpha. Over the same period, thousands of employees have made life changing fortunes.
Investment Banks are like English Football Clubs. Great for employees, lousy for shareholders. These companies were once Partnerships. These do not have Principle/ Agent issues and may be the more appropriate corporate structures for Investment Banking.
Valuation
MS appears overvalued at ~2.1x tangible book value. It may be that the market is not fully pricing in its excess capital that can be deployed for further acquisitions and/or dividends and buybacks.
MS’s pre-tax margins have increased from 9% percent to ~30% in the last decade. The growing businesses of WM and IM do not require much capital. Earnings should be recycled back into growing these businesses. Over time, this would make MS a more profitable and attractive business.
However, given the incentives noted above this is unlikely. Management is likely to allocate more capital to the IS business.
MS is currently benefiting from a cyclical upturn in banking and may be very profitable over the next few quarters. However over the long term the cyclical aspect of the business will invariably lead to a greater volatility and declines in earnings.
Conclusions
We are long term investors looking to deploy small amounts of capital. The structure of the MS business and long-term track record does not suggest shareholders will be well served here. We cannot make a long term investment. however, a short-term opportunistic investment can be considered as a play on the upturn in the Investment Banking cycle.
We have decided to search for better opportunities and look elsewhere. However, we will continue to monitor Morgan Stanley.


