Applied Materials (AMAT)

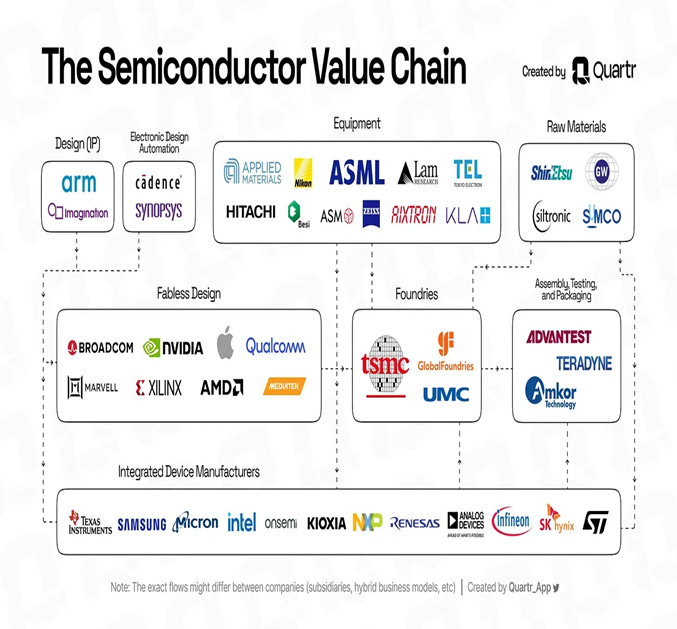
Semiconductor Capital Equipment Suppliers.
In our series of reports on chip companies, we have looked at Nvdia, Broadcom, Cadence, TSMC, AMD, Intel and Synopsys.
We should also look at companies which provide capital equipment to the Chip Manufacturers. We will start with Applied Materials. After this, we will also try and look at two other US companies KLA and Lam Research and Netherlands-based ASML.
Demand for the whole sector is driven by Capital Expenditure by foundries such as TSMC, Global Foundries, Samsung and Intel and many other less well-known names.
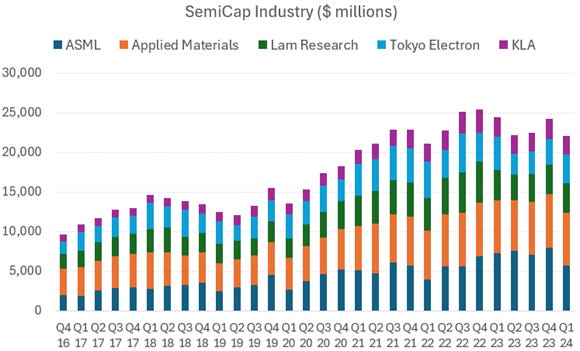
After Covid-19 and the WFH-driven boom of 2020-2022, the semiconductor capital (semicap) equipment industry saw a cyclical correction. However, semicap shares have been rallying over the last six months in anticipation of a new round of strong orders.
In general, capital expenditure by chip manufacturers has been rising strongly since the Covid-19 Pandemic. The chart below shows the annual capital expenditure of Intel and TSMC, the the largest chip manufacturers. We discussed the drivers for this in our recent report on both companies which can be seen here and here.
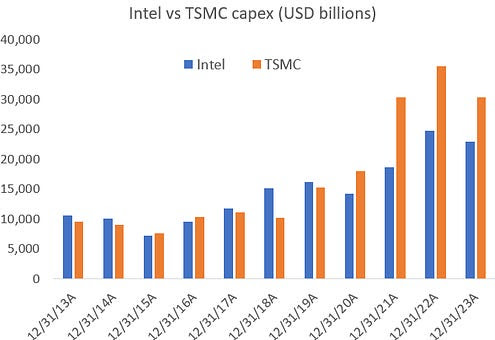
Data above in US$ millions not billions(!).
Semiconductor manufacturing equipment is a cyclical industry but offers attractive exposures to innovations in leading-edge chips, such as the evolution of transistor architectures and advanced packaging.
As transistors continue to shrink in size (as Moore’s law plays out) while featuring ever more elaborate 3D structures constructed from a variety of materials, more manufacturing process steps are needed requiring more advanced tools.
Later this decade, the semiconductor industry is widely expected to reach annual sales of $1trn in size. At that point, the capital equipment sector is expected to become a $150 to $200bn industry, assuming a capital intensity (capex/revenues) of 15 to 20%.
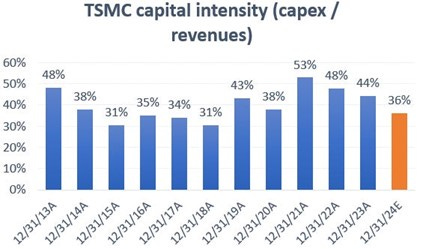
Capital intensity is much higher for leading edge chips: TSMC consistently spends 30% to 50% of revenues on capital expenditure – see chart below
Applied Materials (AMAT) - Capital Goods Supplier to the Semiconductor industry
Key Data ( as of 8 July 2024)
Market capitalisation - $200bn
Annual sales - $26,517mn (FY 2023)
Annual Operating Profit- $7,652mn (OPM -28.9%)
34 year stock return - 21% CAGR
10 year stock return - 28.5% CAGR
Applied Materials (AMAT) was incorporated in 1967 and listed in 1972. AMAT supplies manufacturing equipment, services & software to the global semiconductor, display, and related industries. Its early customers included Fairchild Semiconductor and Intel. In essence, they make and service machines which manufacture computer chips, flat panel TVs and solar devices.
AMAT’s customers are manufacturers of chips which go into items such as computers, phones liquid crystal displays (LCD)/photovoltaic cells and which, they sell to manufacturers of advanced electronic components and products. Most of AMAT’s sales are to integrated device manufacturers /foundries worldwide.
AMAT is a leading supplier of machinery for all stages of chip manufacturing except Lithography (where ASML is the leader). AMAT has 22,000 employees in 19 Countries. The company claims to have 14,300 active patents. Their expertise is in modifying materials at atomic level and on an industrial scale.
ASML is the kay player on the playout of Moore’s Law as Chip sizes shrink. We discussed Moore’s Law in detail in out report on Intel which can be found here.
Other companies such Applied Materials, Lam Research and Tokyo Electron offer exposure to the various vertical stages in chip manufacture.
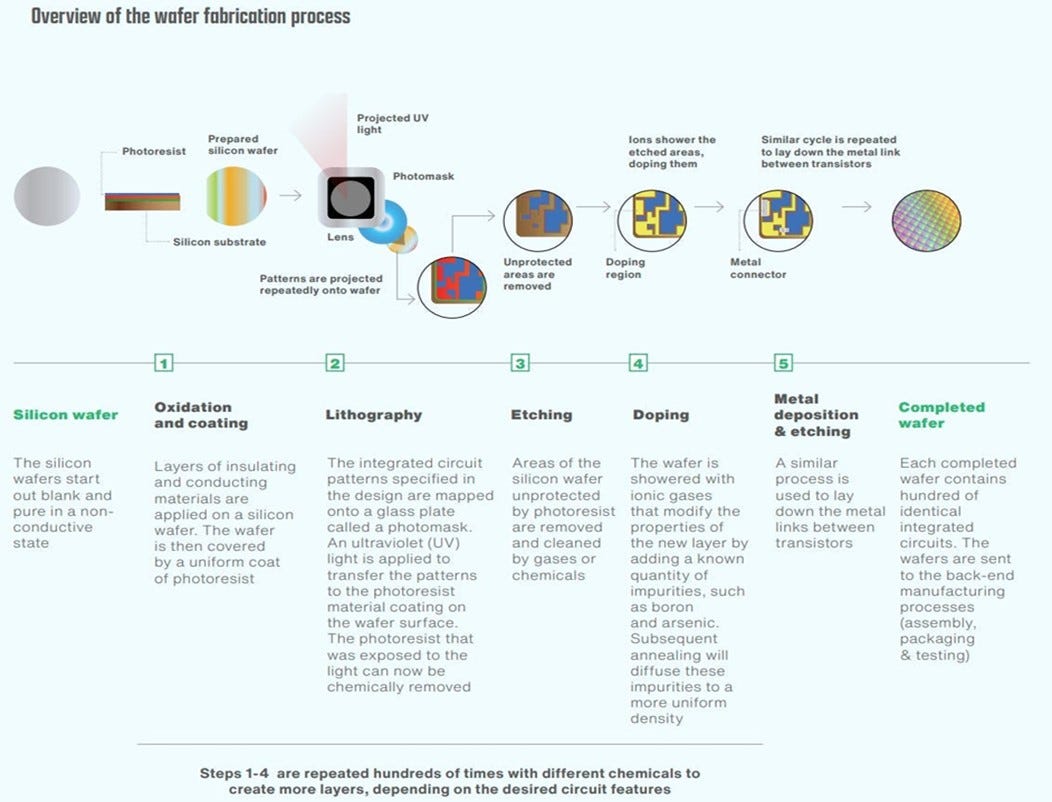
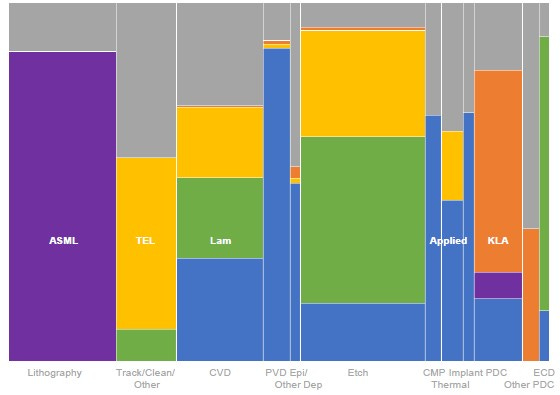
Once a chip's pathways have been lithographically etched, the transistors and copper wire interconnects are grown using a combination of electroplating, ion implantation (doping), chemical vapor deposition, atomic layer deposition, and more. AMAT provides equipment and associated services to all these manufacturing stages ( as seen in the blue bars in the chart above) .
They are described in more detail below:
CVD -Chemical vapour deposition (an early core expertise for AMAT)
PVD – Physical Vapor Deposition
Etching - a process which selectively removes material from a thin film on a substrate and creates a pattern of that material on the substrate. AMAT innovated with etching machines in the 1980s and came to dominate the market after three iterations of machines.
CMP – Chemical mechanical planarization - a process used multiple times in the manufacturing process at each layer of the wafer to remove excess materials and create a smooth surface
PDC – Process diagnostic and control
We discussed chip making in our note in Intel which can be found here. More details can be seen here: https://www.asml.com/en/news/stories/2021/semiconductor-manufacturing-process-steps
ASML is the dominant player in lithography with a likely 90% global lithography market share. AMAT provides tools that cover a wide range of functions as shown in the blue shaded segments in the chart above. These include Chemical and physical vapour deposition .
This short video gives some insights into the nature of their work with particular emphasis on the advanced material technology involved and the small scale that they work at ( “nanosphere”).
The video below gives a more detailed overview of the company and can be listened to 1.25 X the sped as it is 20 minutes long.
The above video gives a more detailed picture on AMT.
The three key business segments for financial reporting of the AMAT are shown below:

The top two segments account for ~ 90% of revenues and serve the same customer base.
AMAT’s equipment handles the complex processes of making chips from laying down patterns on silicon at the beginning to packaging them for the shipment at the end. Their three largest customers are Samsung Electronics, Taiwan Semiconductor and Intel Corporation who account for between 10% -14% each of sales.
In addition to leading-edge chip customers, they have many other customers who are engaged in less advanced chips, memory and logic chips and analogue chips. The customer base is concentrated and has become more so because of continued consolidation in the industry.
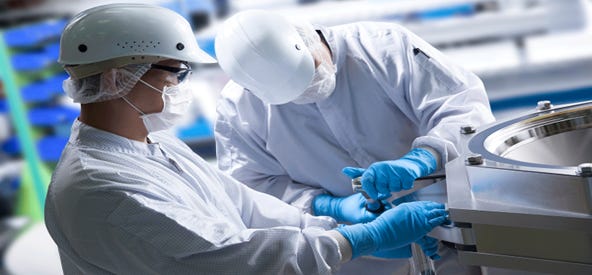
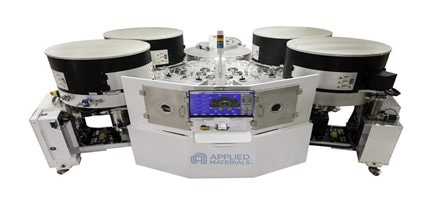
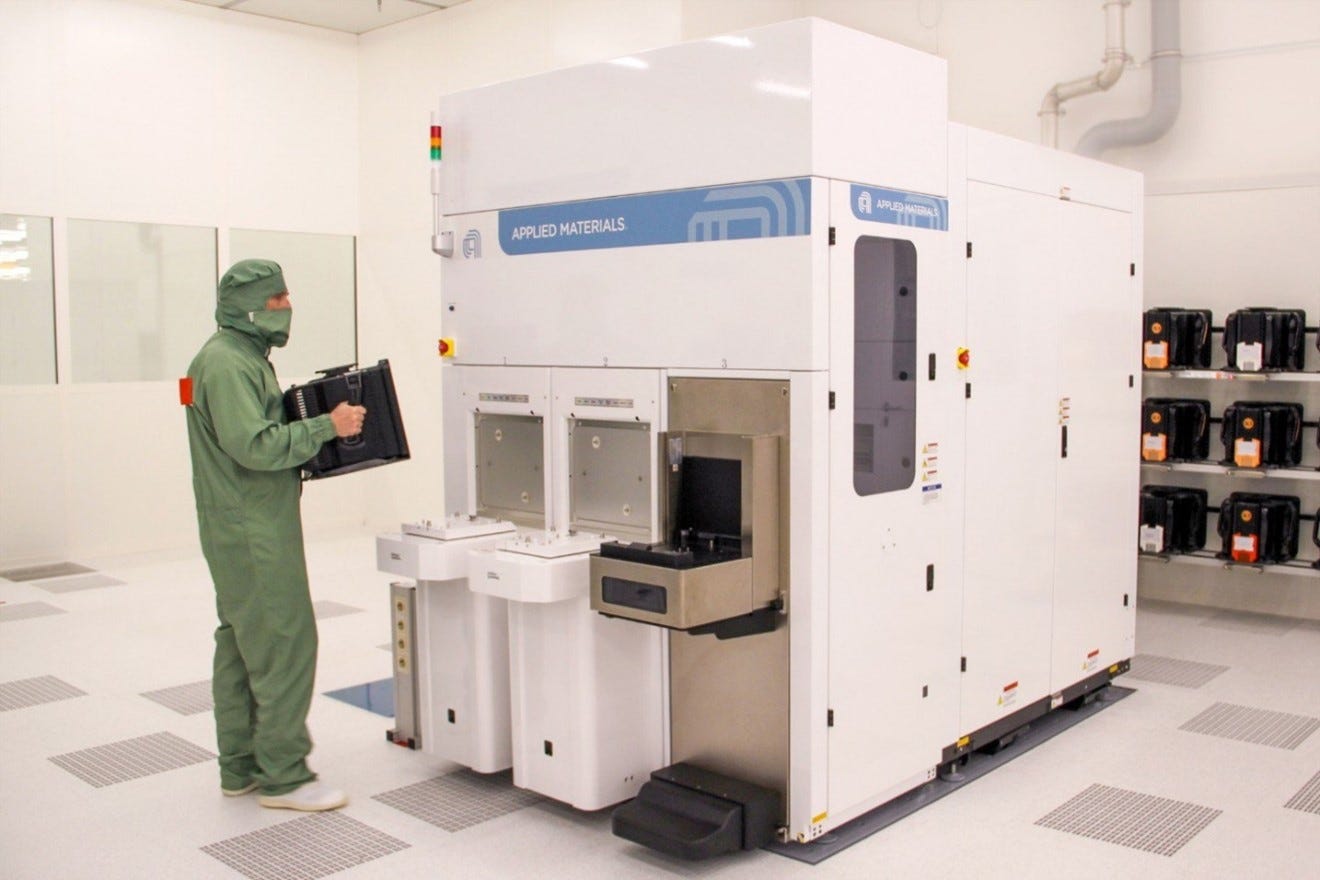
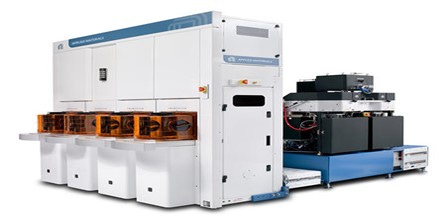
AMAT machinery Image Source: Applied Materials
AMAT is based in California with manufacturing locations both in the USA and overseas.
How has AMAT performed?
Since September 1989, investors have got a return of 21% CAGR. AMAT has performed very well in recent years. In the last five years, the stock has given a CAGR of 42.4%. According to some commentators, this is likely to continue given the high level of capital expenditure planned by the major chipmakers (see below).
Structural features of the industry
Demand is driven primarily by customer spending on capital equipment and services to
support key technology transitions or
to increase production volume in response to worldwide demand for semiconductors and displays.
“This is a real cyclical industry. As the world came through COVID, a lot of demand frankly got pulled forward. Everybody was buying new PCs, phones, TVs… The industry, sometimes we mistake what's going on, some of us got a little bit confused that it was secular growth. Inventory got built with a volume assumption that was just too high and so we're still digesting that, especially in memory. NAND is still soft this year, I think next year is going to be better.”
“We are currently going through a period of higher demand for chips and the industry is in an upcycle with DRAM demand leading the way.”
As a capital goods supplier, one would expect AMAT to be especially vulnerable to a change in the economic cycle. They are three steps away from the final customer who is the retail buyer of equipment which embeds chips or who buys cloud services. This reduces their visibility of the end demand.
However, the industry seems optimistic and is expecting higher demand in the foreseeable future.
“We expect that investment for leading edge DRAM will start to recover from May 2024, driven by growing demand for DDR5 and HBM among others.
“In calendar 2025, a full-fledged recovery in capital investment is also expected for NAND and advanced logic chips, with as one of the drivers being AI servers, whose annual growth rate is 31%.”
“In addition, AI will be mounted not only to servers but also to PCs and smartphones.”
“Also, there will be demand to replace those products purchased during the COVID-19 crisis.” Driven by those factors,
These comments on the evolution of demand were made by the CFO of Tokyo Electron. Tokyo Electron is one of the few significant competitors of AMAT and the two companies tried to merge in 2014.
The strongest recent demand boost is due to the growth of new datacentres need by GenAI workloads.
More broadly, in recent years, AMAT has identified the growth of data and emerging end-market drivers such as artificial intelligence, the Internet of Things (IOT), 5G networks, smart vehicles and augmented and virtual reality are also creating the next wave of growth for the industry.
In 2019, they called this wave, the fourth era of computing. This is illustrated below:
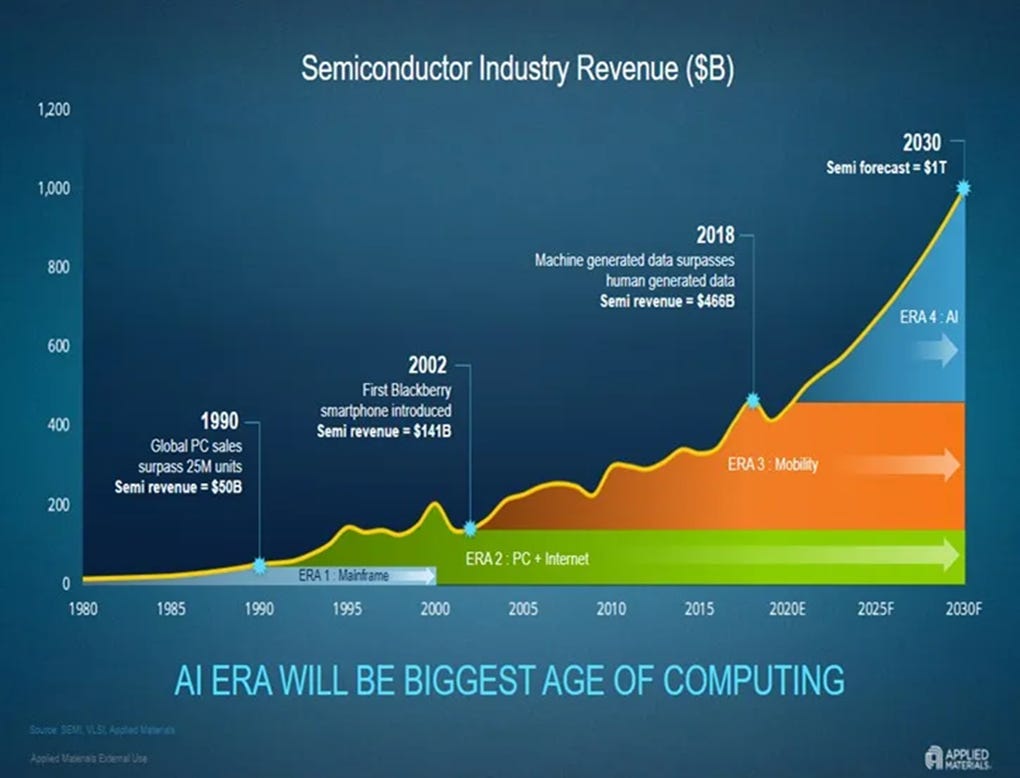
In AMAT’s view, the first three eras of computing were driven by Mainframe, PC (+ Internet) and mobile telephony, respectively.
In 2019 they predicted the fourth era will be driven by the application of Artificial Intelligence (AI). This era is expected to be the biggest and would drive total semiconductor industry revenue from the 2020 level of $ 500bn to $1trn in 2030.
The company argues
“ our long-term growth strategy requires continued development of new materials, engineering capabilities, including products and platforms that enable expansion into new and adjacent markets. Our significant investments in R&D and engineering must enable us to deliver new products and technologies before the emergence of strong demand, thus allowing customers to incorporate these products into their manufacturing plans during early-stage technology selection. We work closely with our global customers to design systems and processes that meet their planned technical and production requirements.”
The video below gives a good overview of the company and can be listened to 1.25 X the speed as it is 20 minutes long.
This indicates AMAT are critical business partner for customers and work closely with them. They are not a supplier of commodity products with lots of substitutes.
AMAT commented on demand trends among the main categories of customers in 2023.
Semiconductor equipment customers continued to make strategic investments in new capacity and new technology transitions during FY23.
Foundry and logic spending increased in FY 2023 compared to fiscal 2022 driven by customer investments in mature manufacturing nodes to serve demand across a wide range of products.
Memory customers’ spending in fiscal 2023 was lower as compared to fiscal 2022 due to deferred capacity additions primarily as a result of weakness in demand for consumer electronic products.
In the last two years, the US government announced additional export regulations for semiconductor technology sold to China. This had a negative impact on AMAT sales as China accounted for 28% of sales in 2022 and 2023 down from 33% in 2021.
The company spends $ 3bn on Research, Development and Engineering (RD&E)
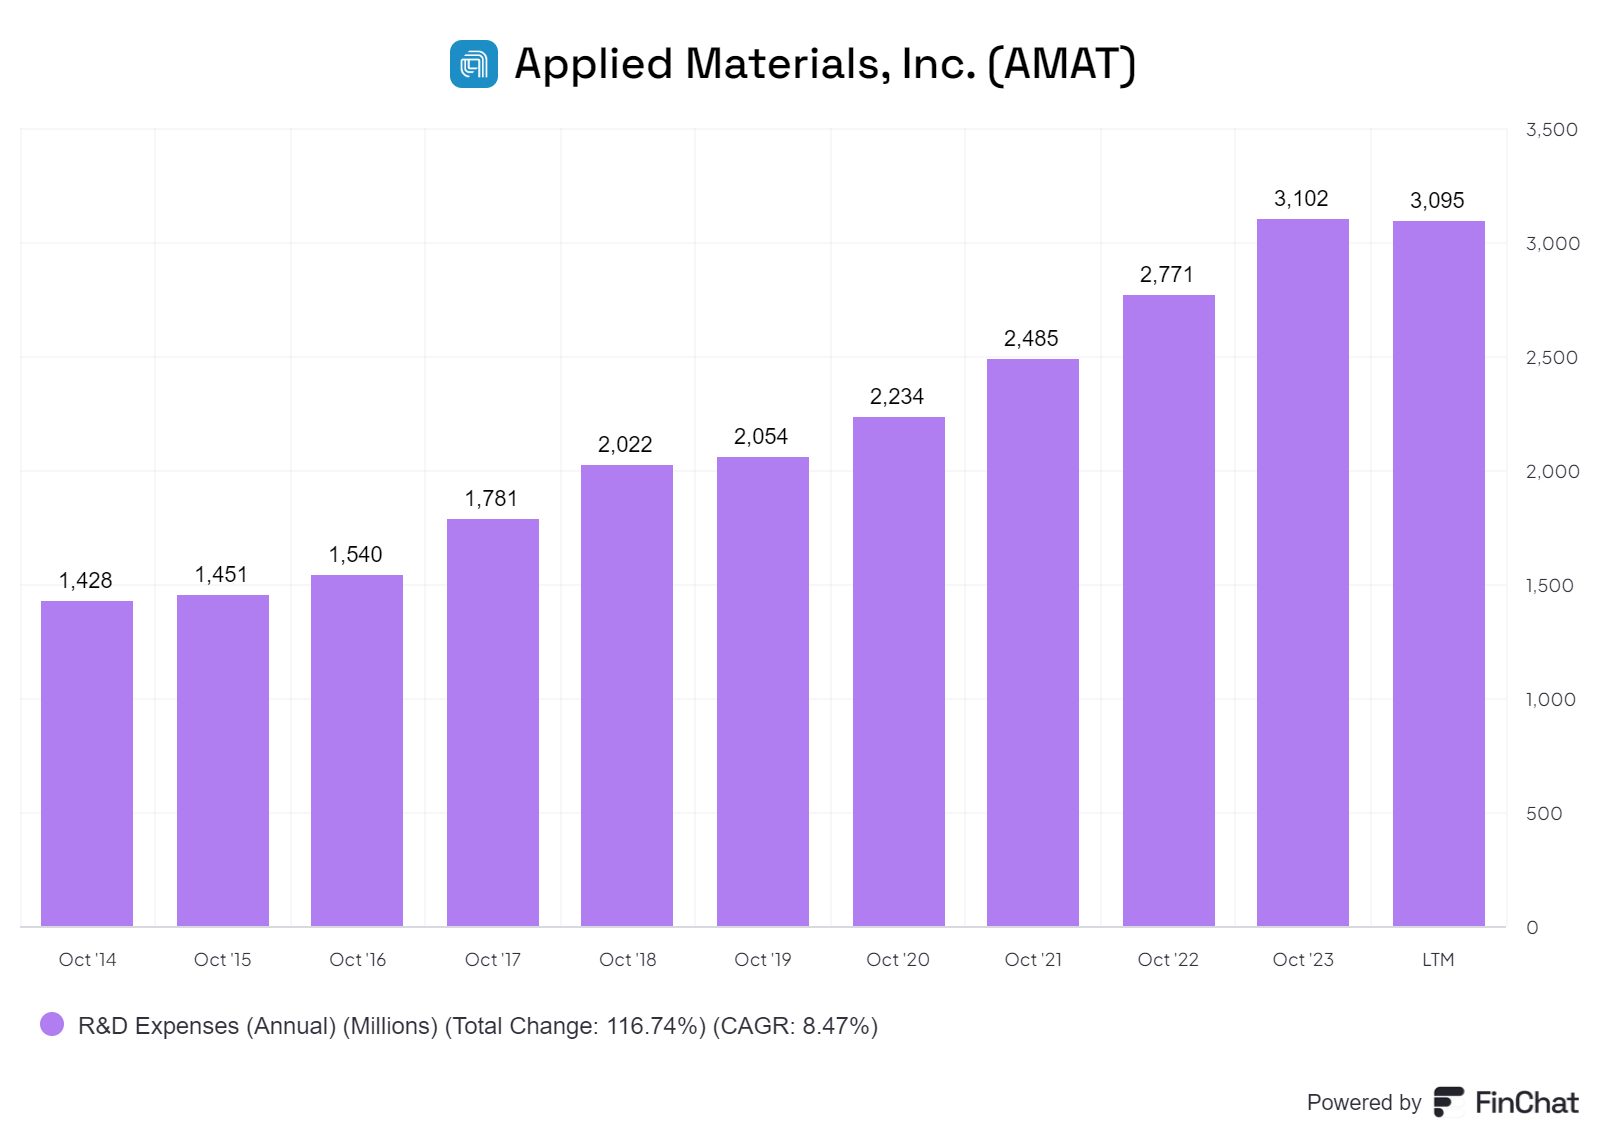
These amounts may be small compared with capital expenditure by Intel, Meta Platforms and so on but AMAT is focused in a very narrow area, which they dominate.
R&D is very important for their future competitive advantage
“Our future operating results depend to a considerable extent on our ability to maintain a competitive advantage in the equipment and service products we provide.”
“We believe that it is critical to continue to make substantial investments in RD&E to assure the availability of innovative technology that meets the current and projected requirements of our customers’ most advanced designs. We have maintained and intend to continue our commitment to investing in RD&E in order to continue to offer new products and technologies.”
“Areas of investment include etch, deposition, metrology and inspection, patterning, packaging and other technologies to improve chip performance, power, area, cost and time-to-market.”
When markets are in a downturn, companies like AMAT many come under pressure to cut RD&E spending. This many boost profits in the short-term but is likely to have negative consequences in the long-run.
Financial overview of AMAT
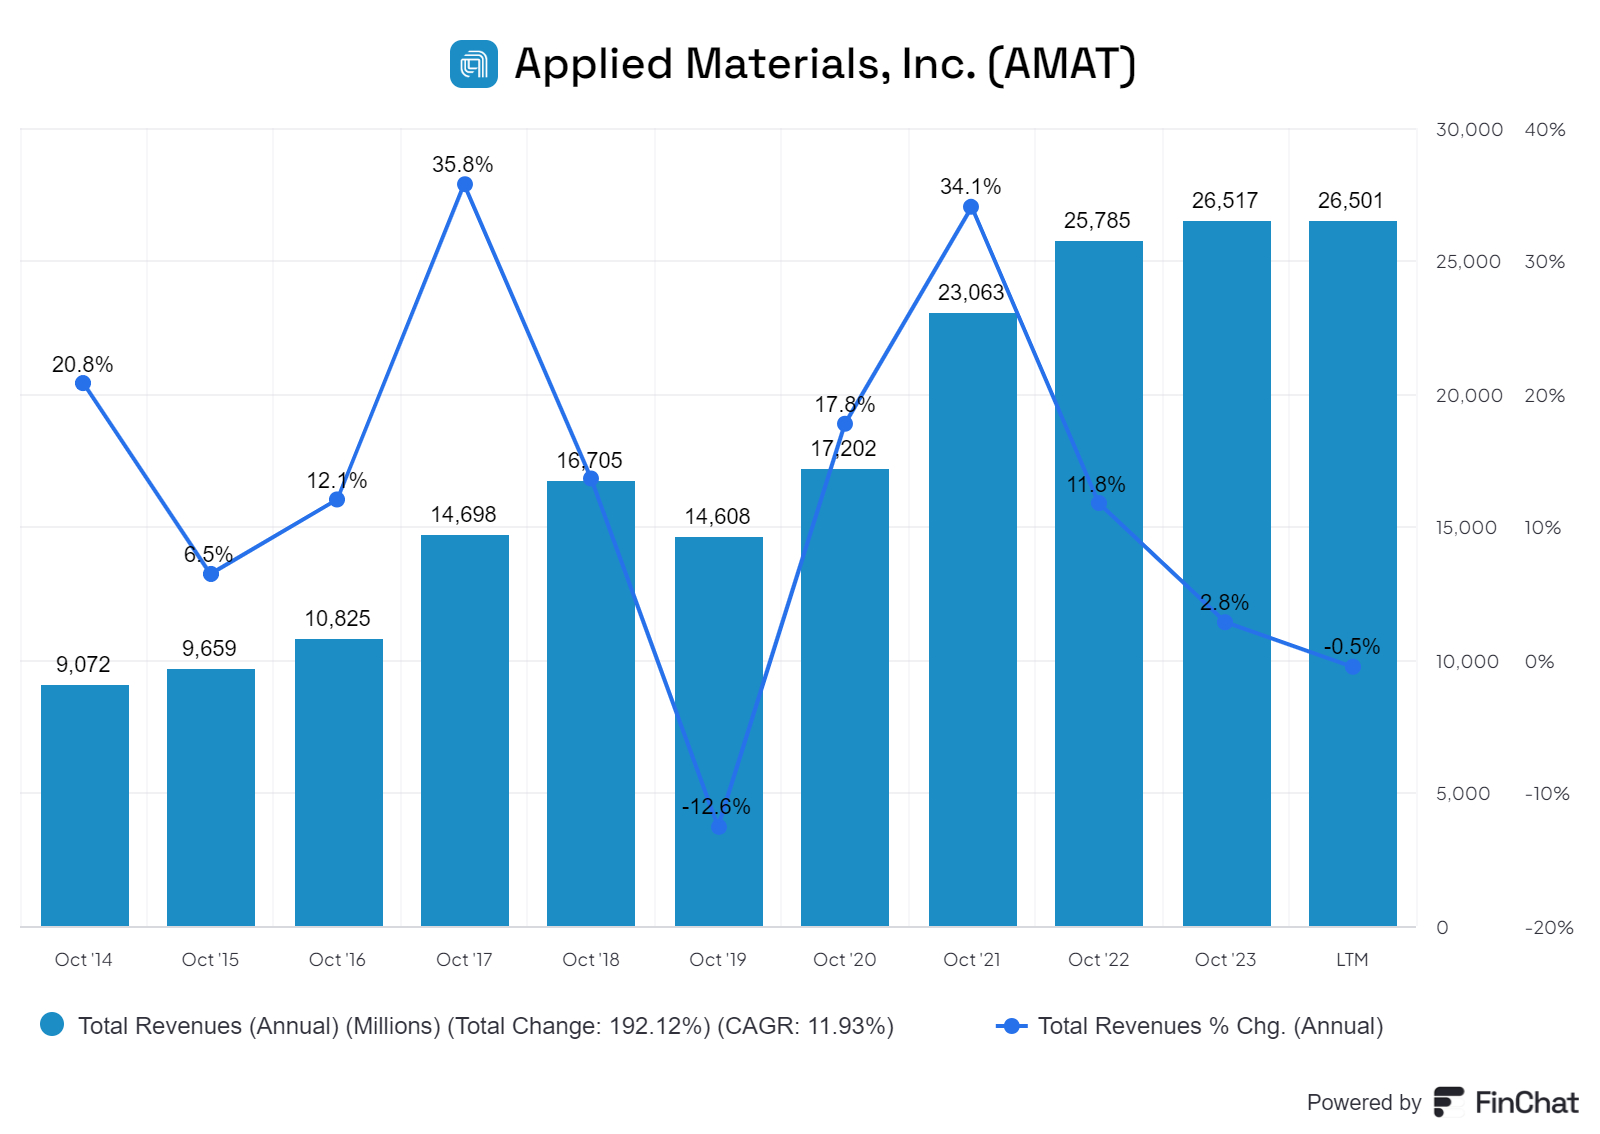
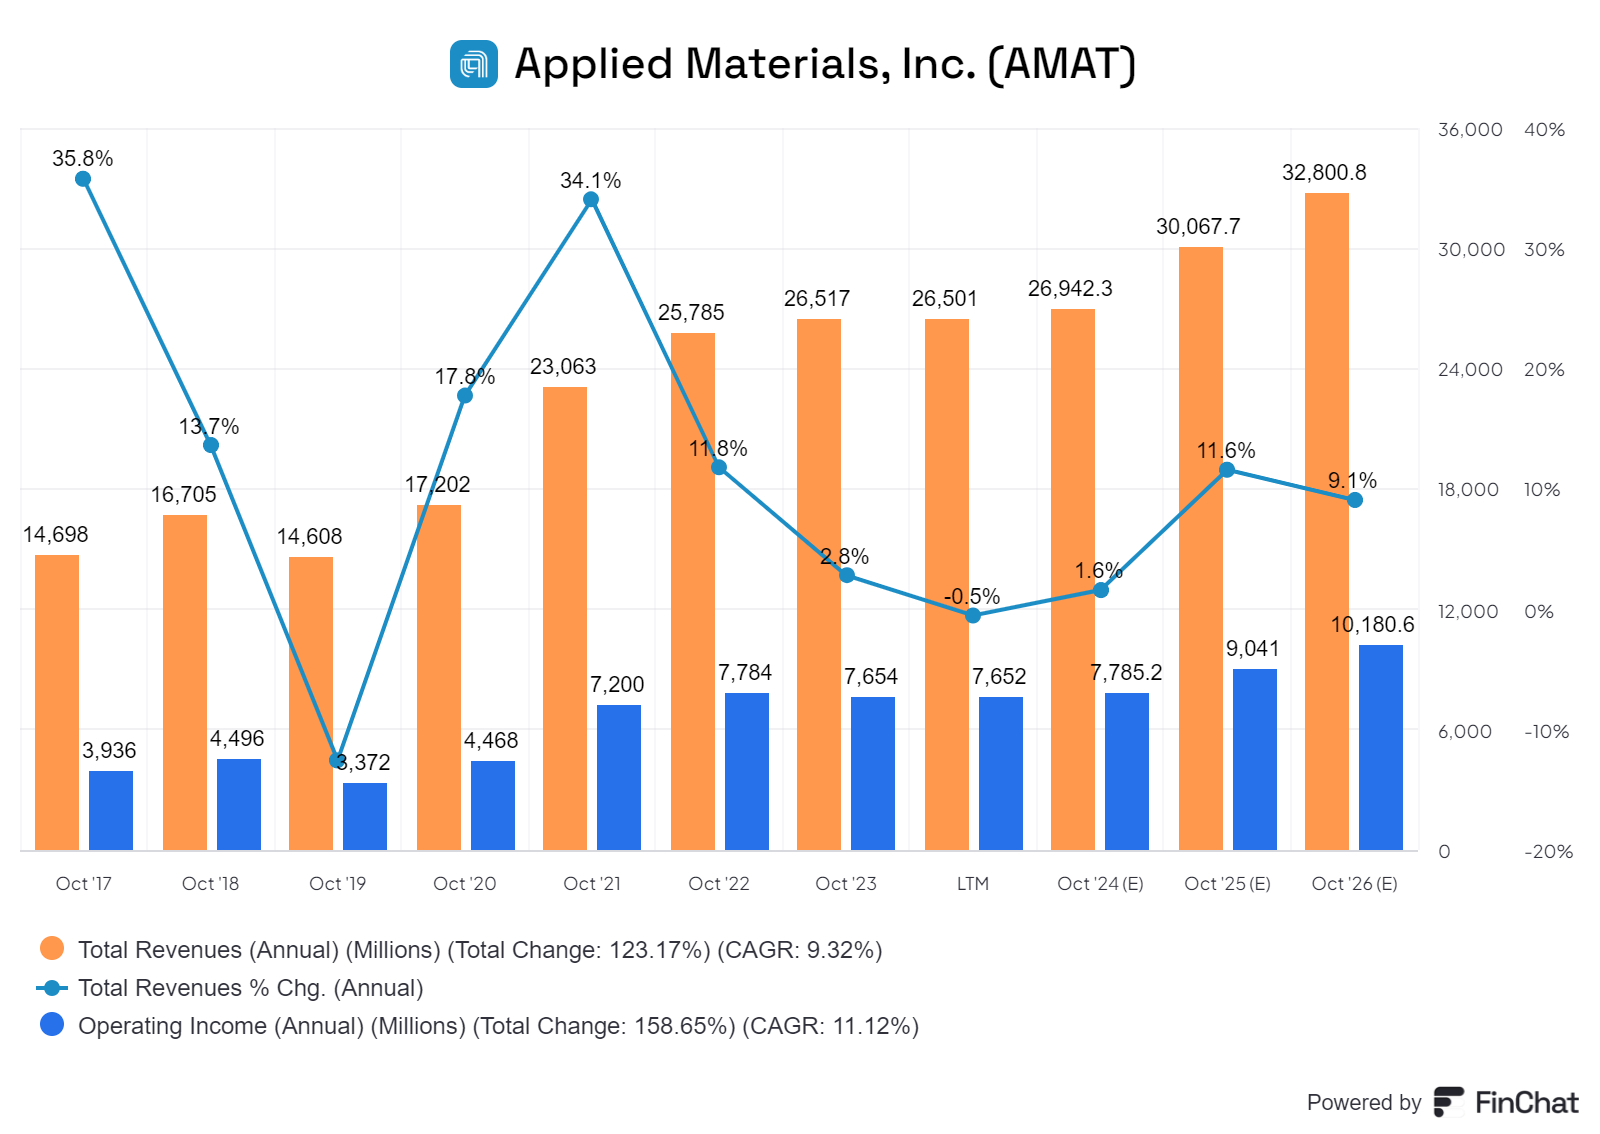
Annual sales have increased from $ 9bn in 2014 to $ 26bn in 2023 but the growth has not been at a steady pace. The annual sales growth line shows the cyclicality of revenues. Revenues seem to have plateaued in the last two or three years.
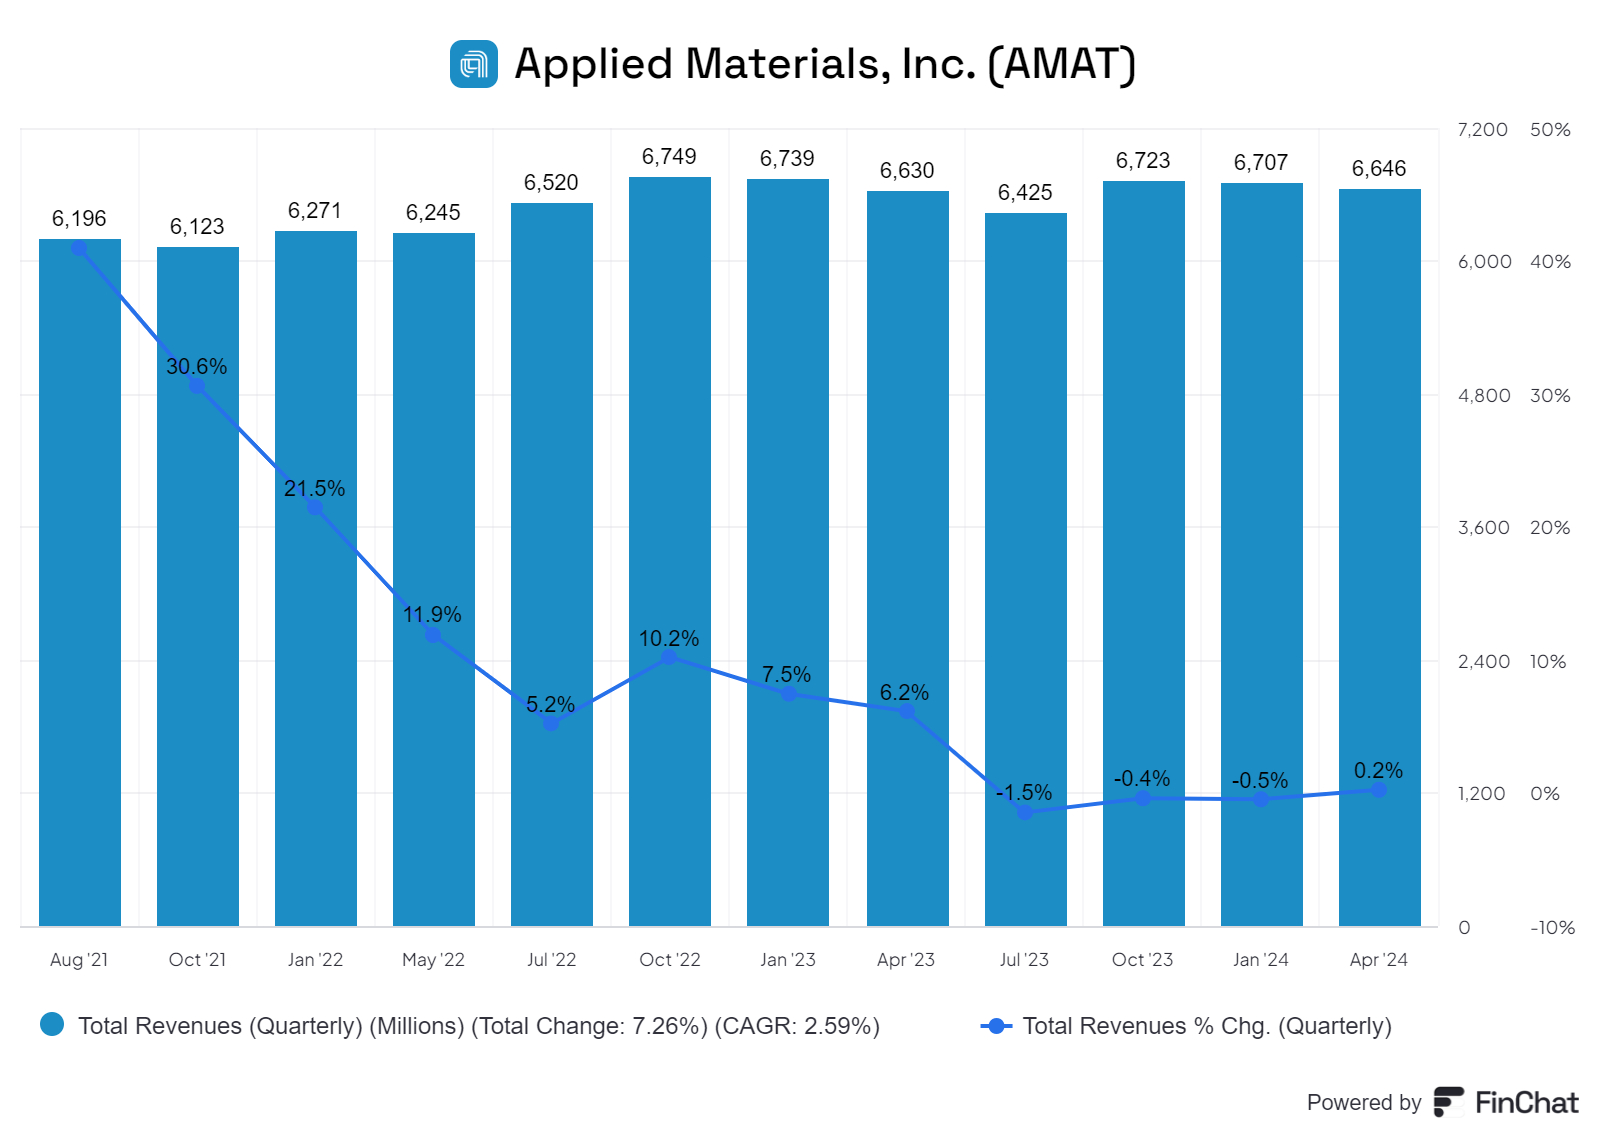
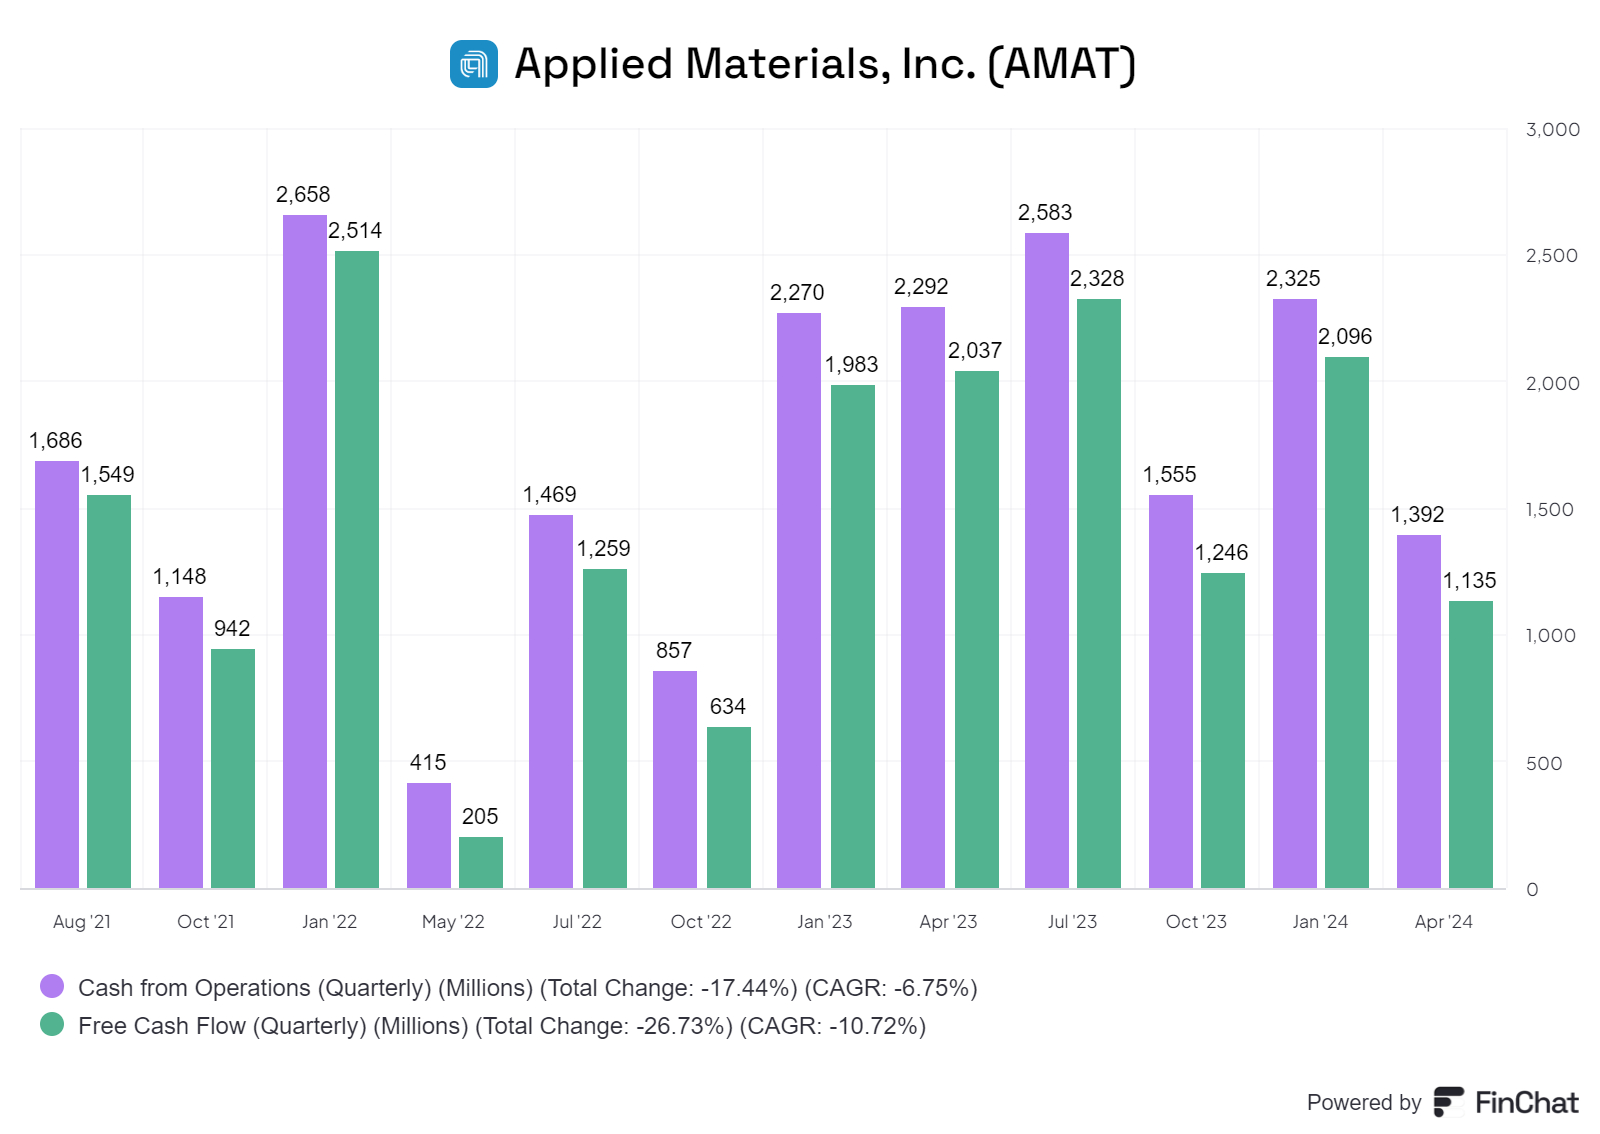
Quarterly sales have been relatively stable at about $ 6bn.
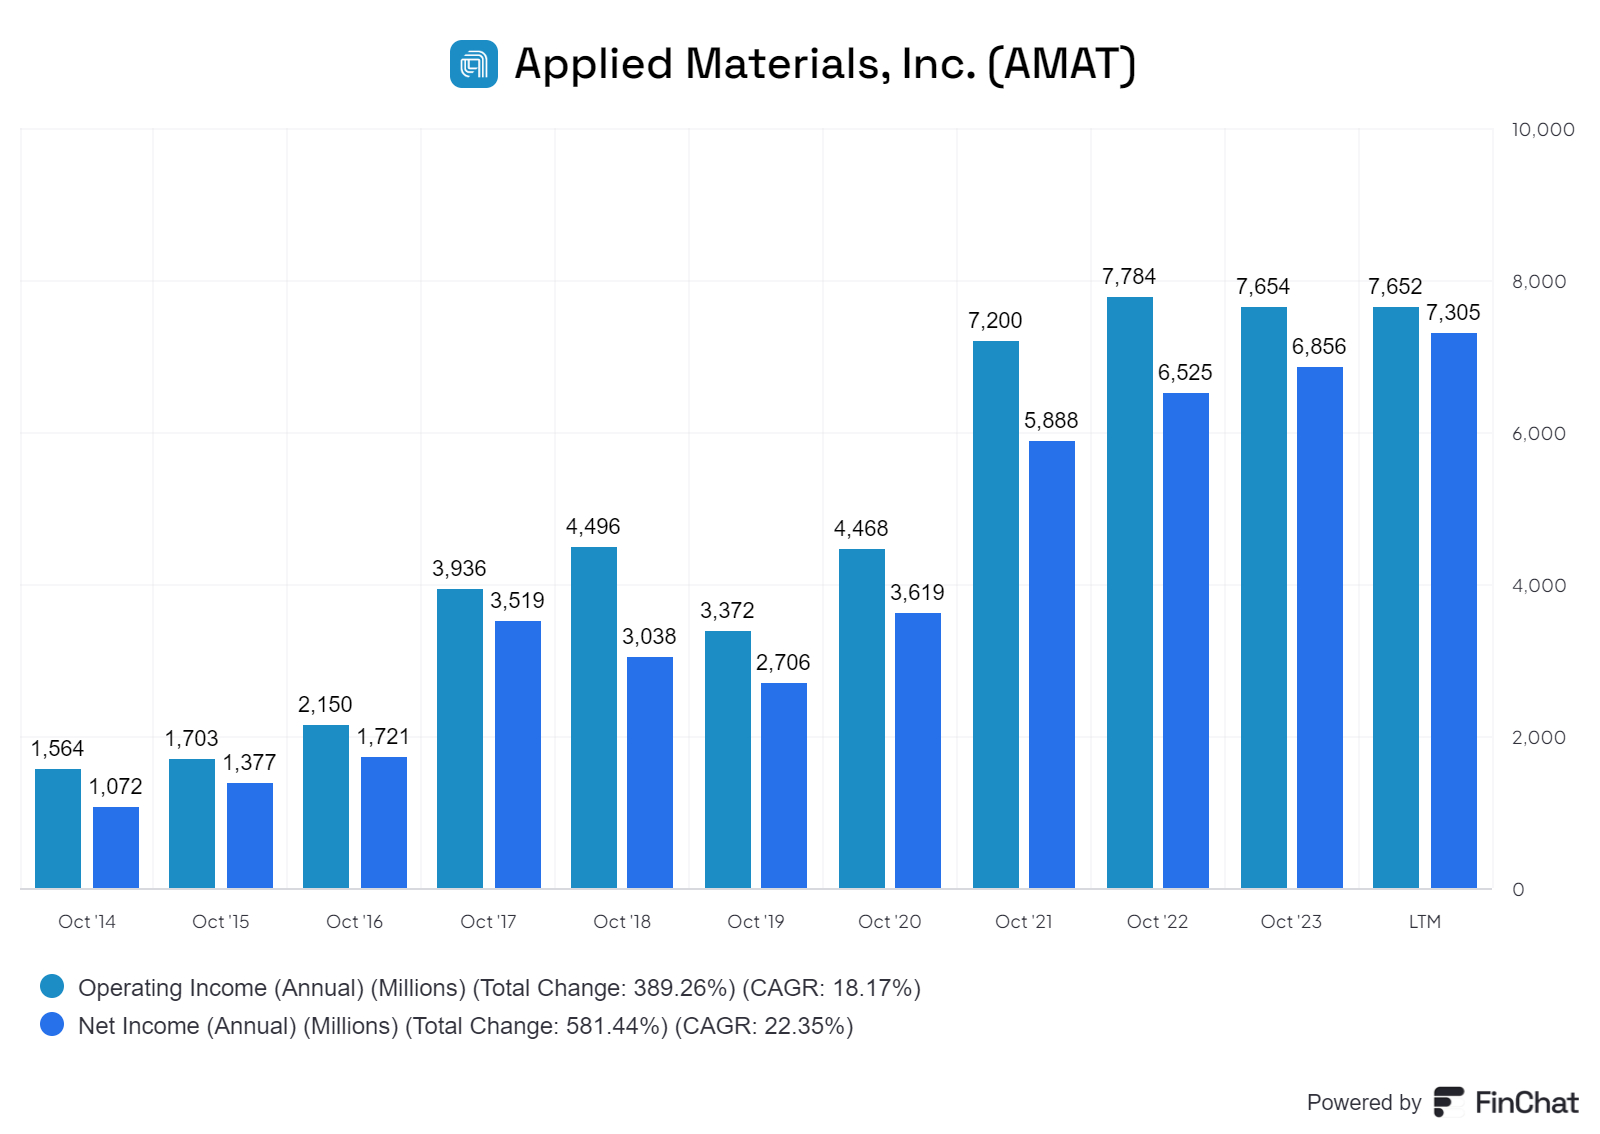
Operating Profit and Net Profits have grown from 2014 to 2024 at a CAGR of 18.2% and 22.4% respectively. However, Operating Income appears to have plateaued in recent quarters as shown below.
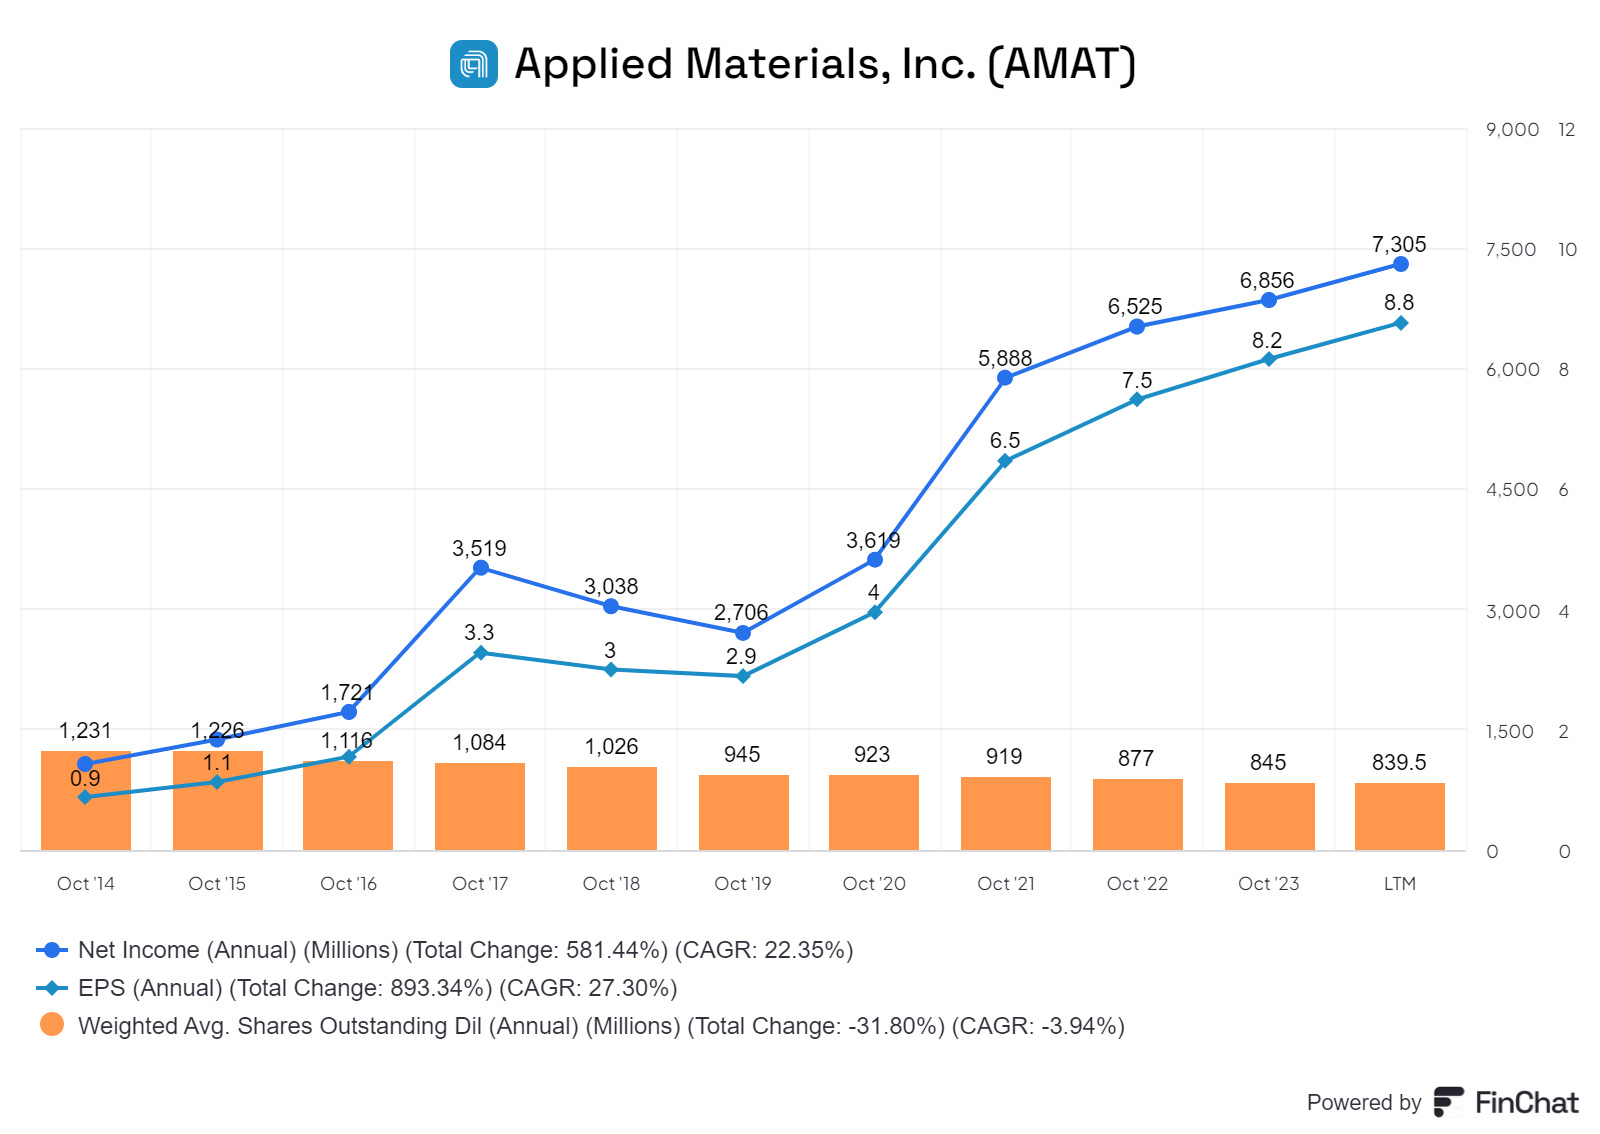
Net income and EPS have grown steadily over the last decade. Net income has grown at a CAGR of 22.4% while EPS has grown at abut 27.3% CAGR. The difference reflects the fact that AMAT has bought back shares and reduced shares outstanding by ~4.0 % CAGR over the last decade.
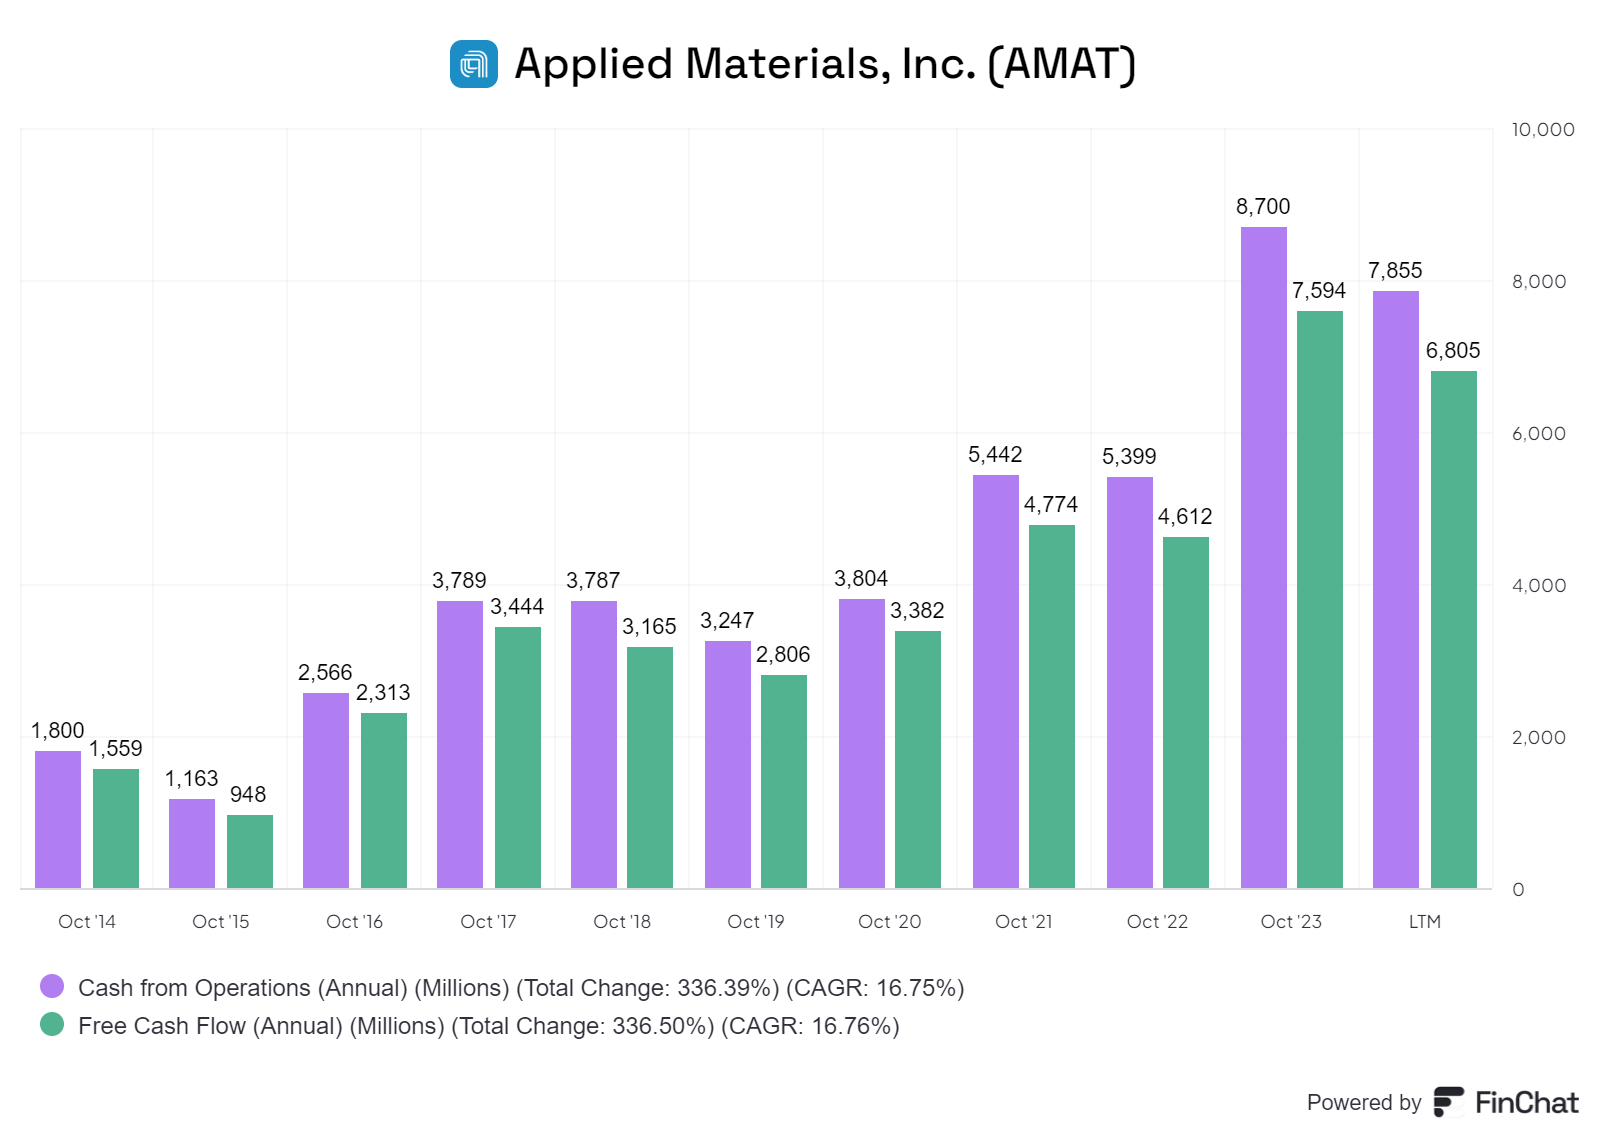
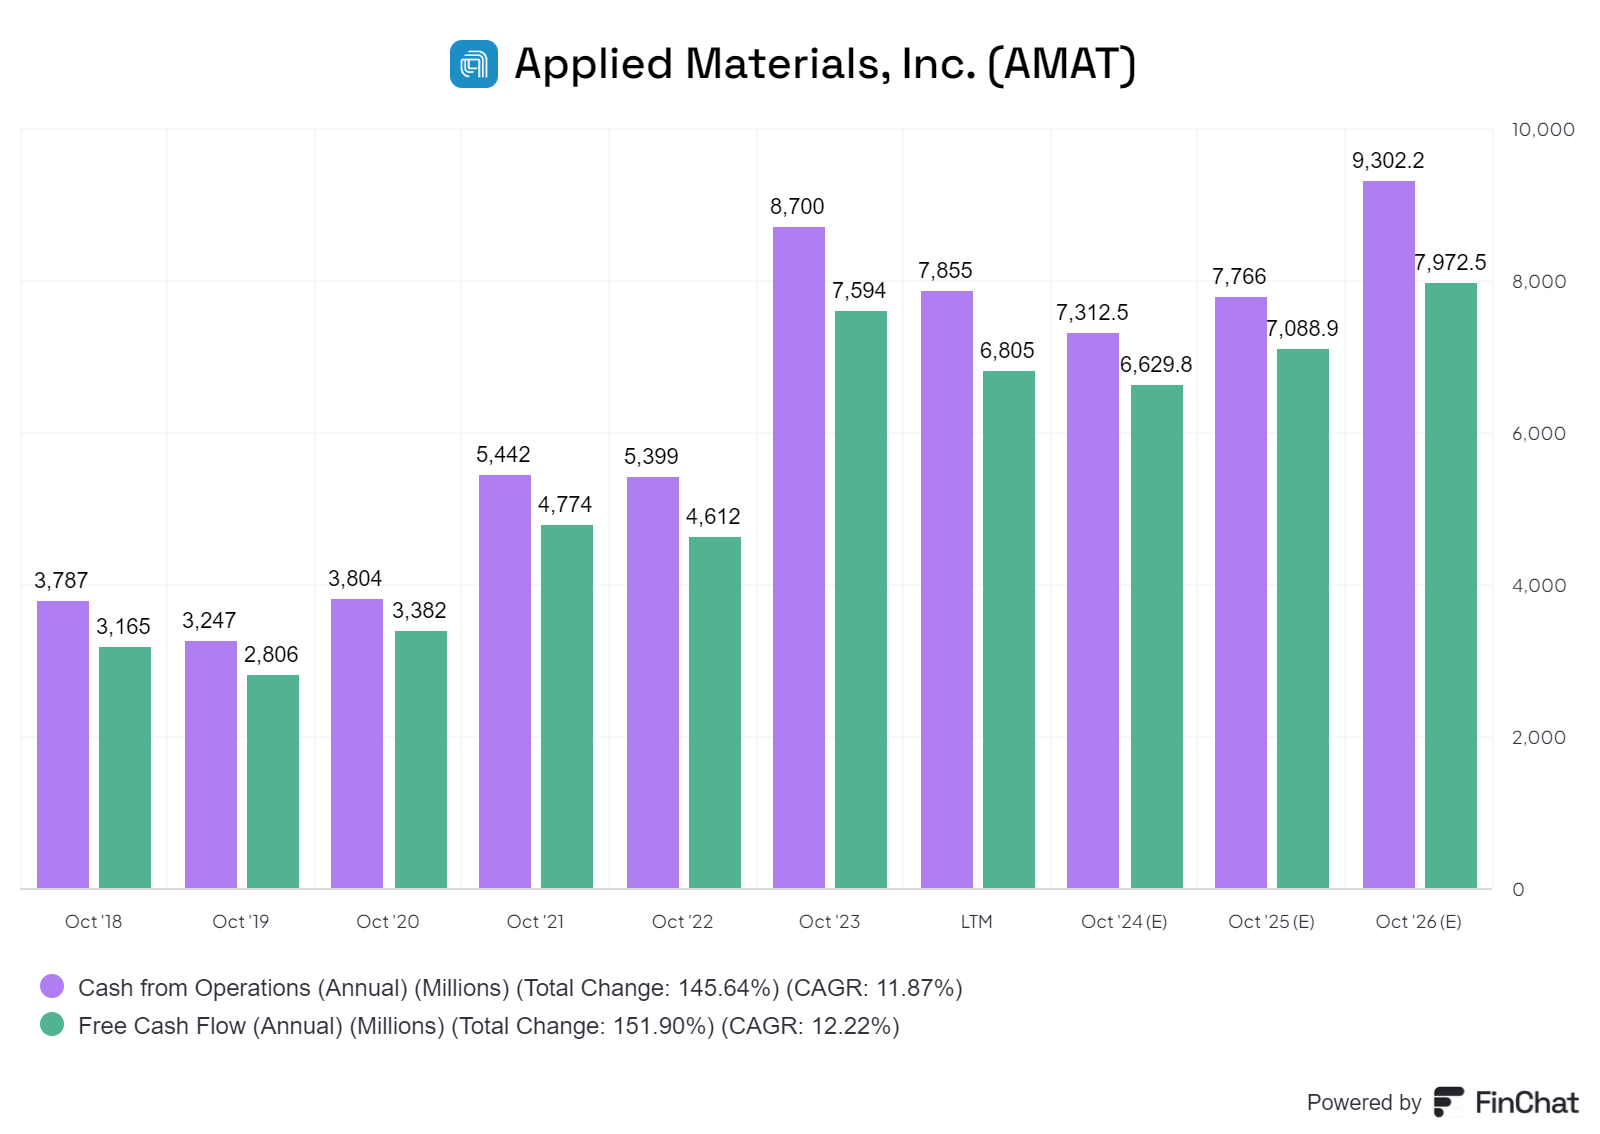
Cash flow and Free Cash Flow (FCF) have also grow in the last ten years. However, they too seem to have plateaued in the last three years.
Gross margins have been relatively stable over the last ten years. Operating margins and Net Margins rose to 2021 but have slowly trended lower in the last three years.
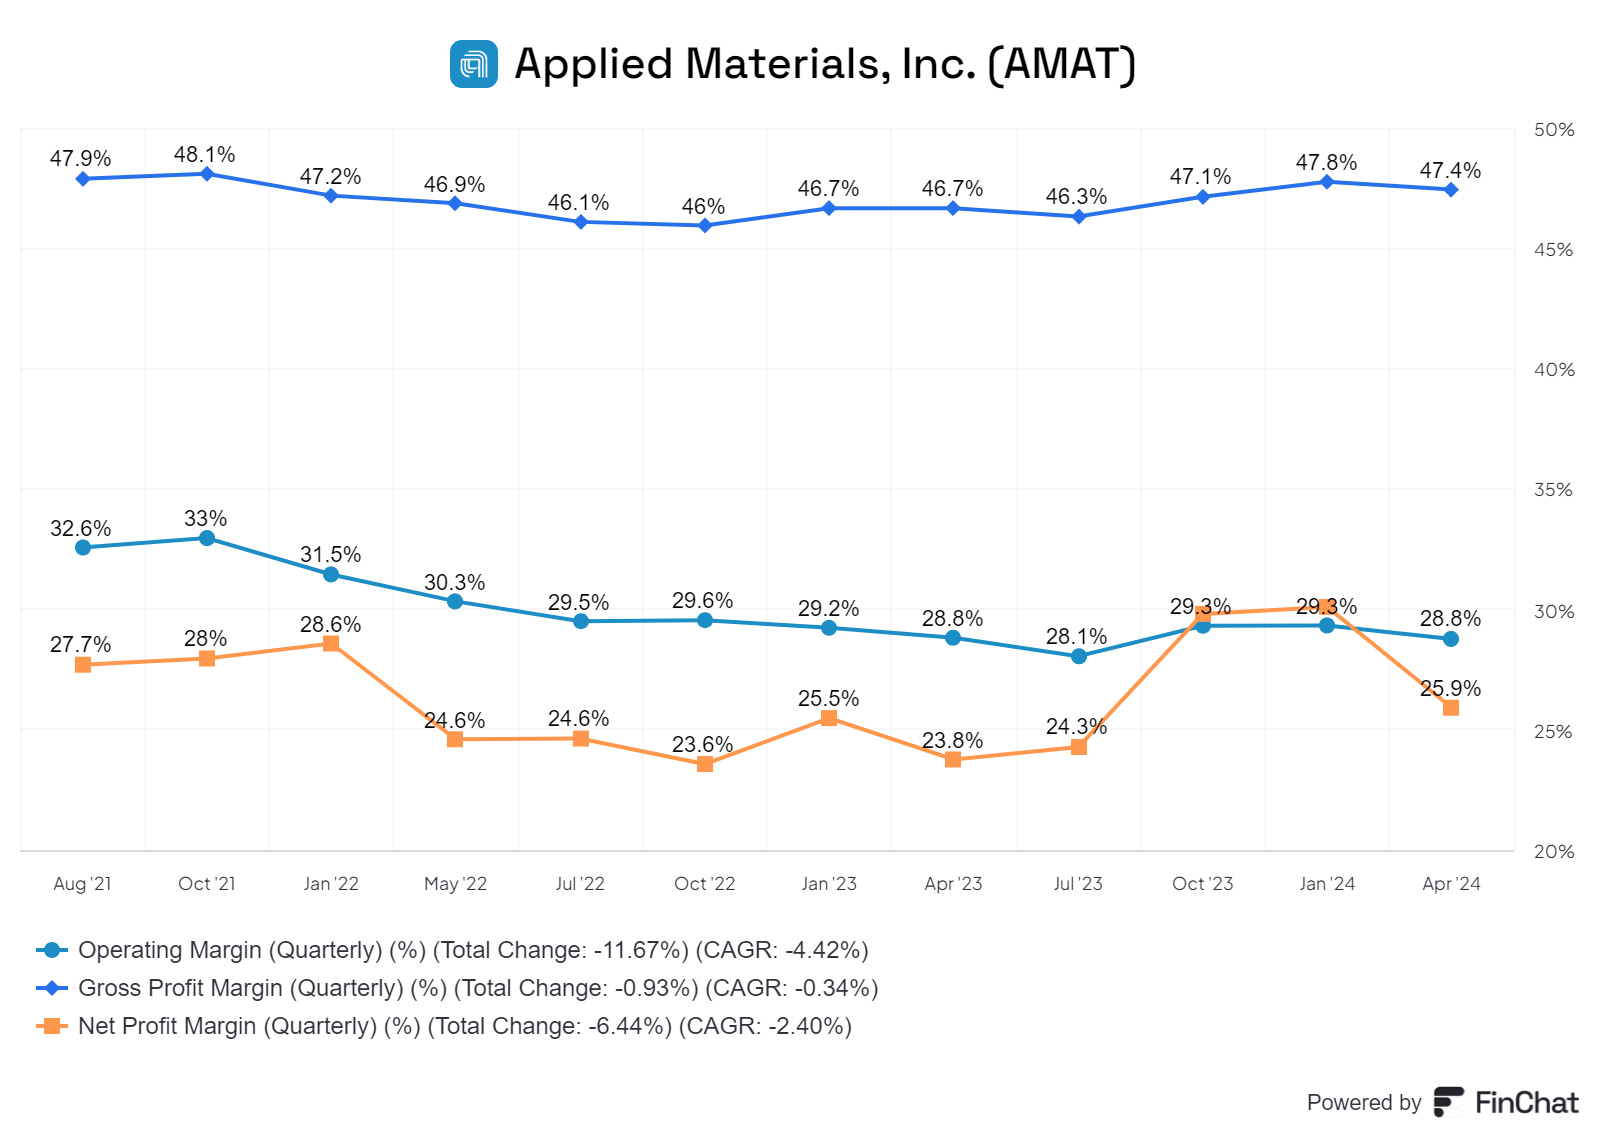
The chart above shows the relative stability of margins with Gross Margins at about 47.4% and Operating and Net Margins in the range 26% to 29%.
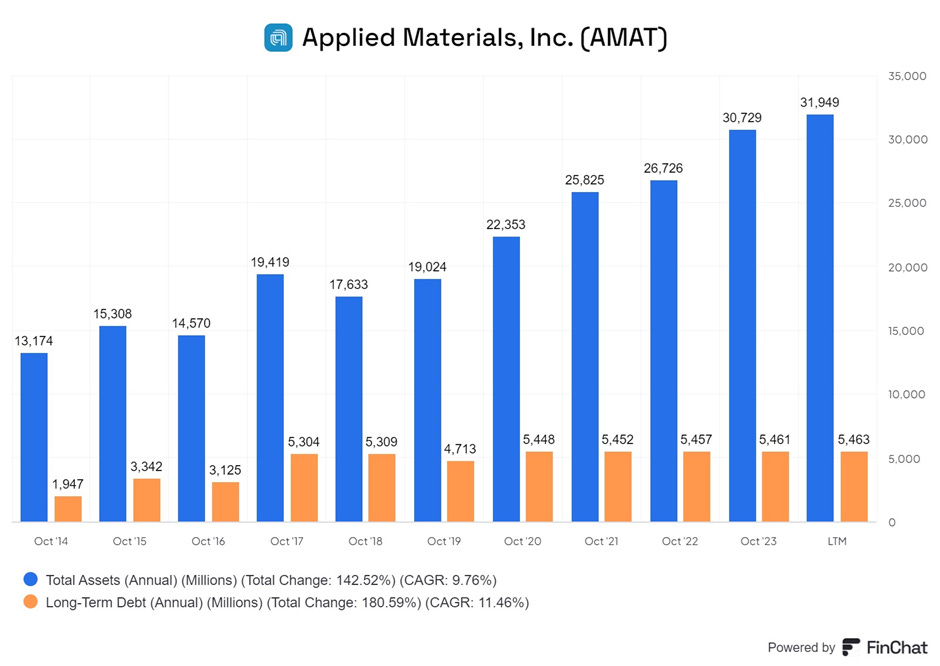
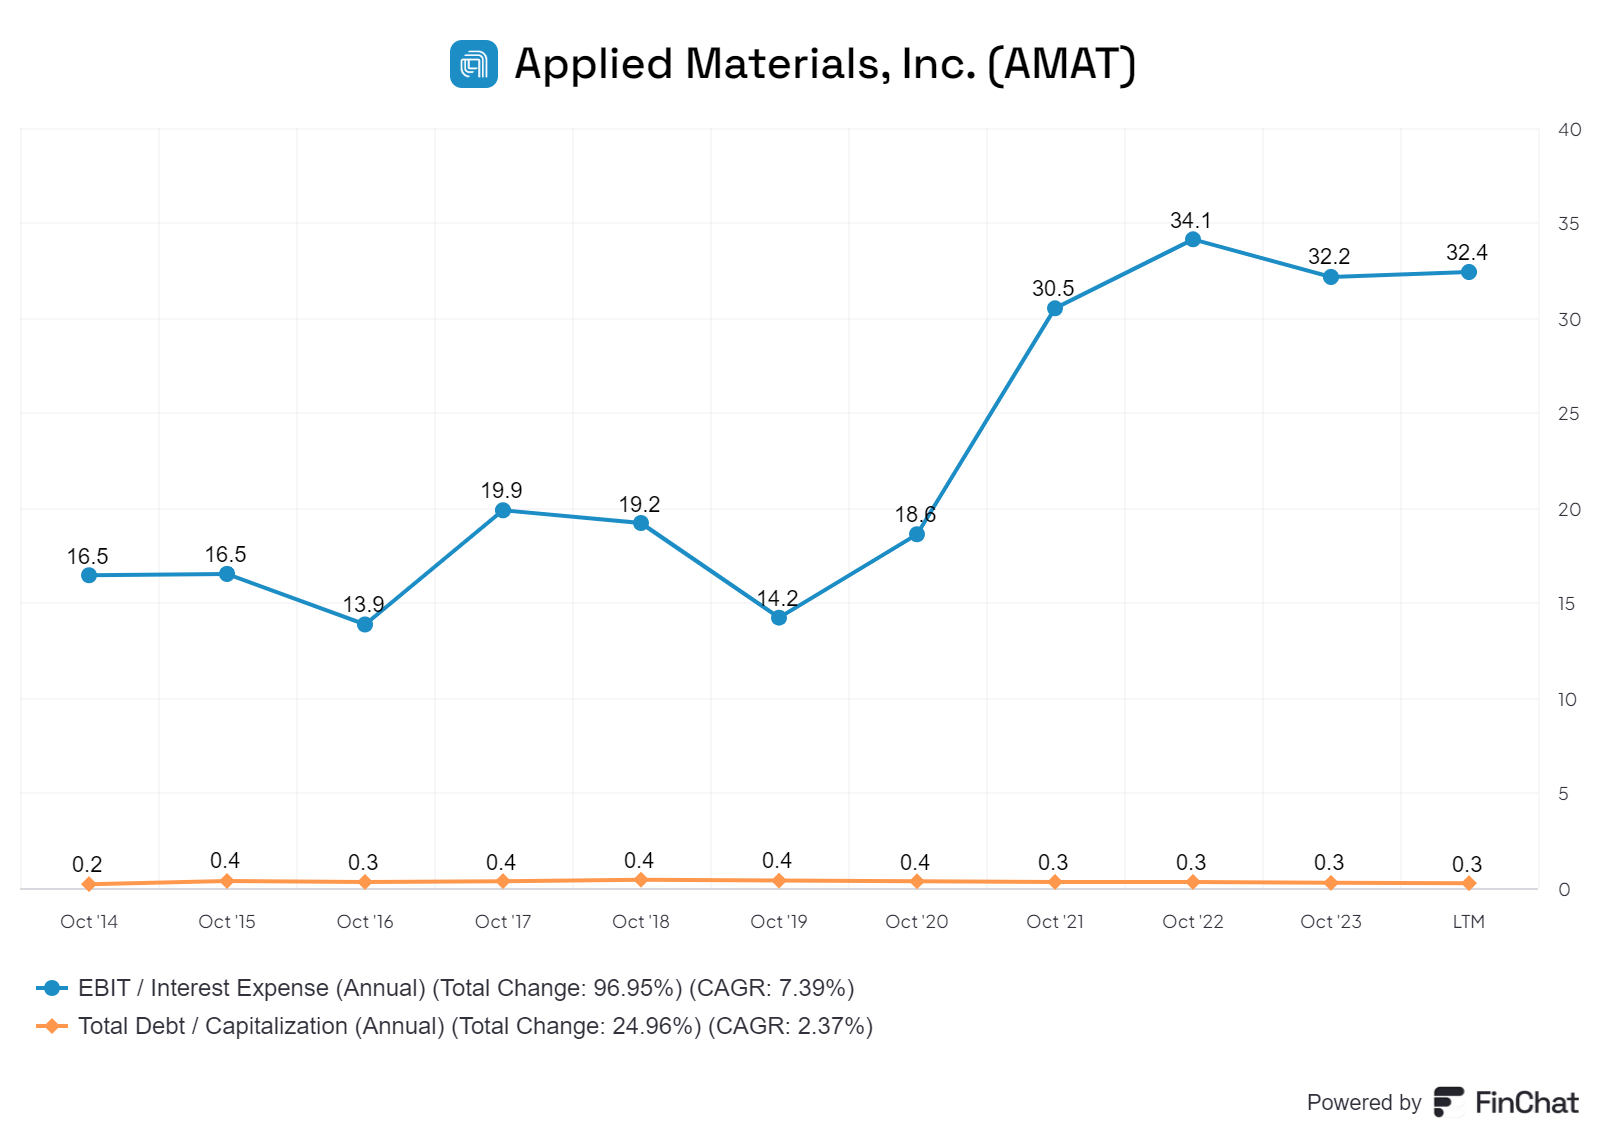
Debt has been stable despite the growth in the total assets of the company. Debt interest coverage has improved in the last ten years. EBIT/ Interest expense has risen to ~32X.
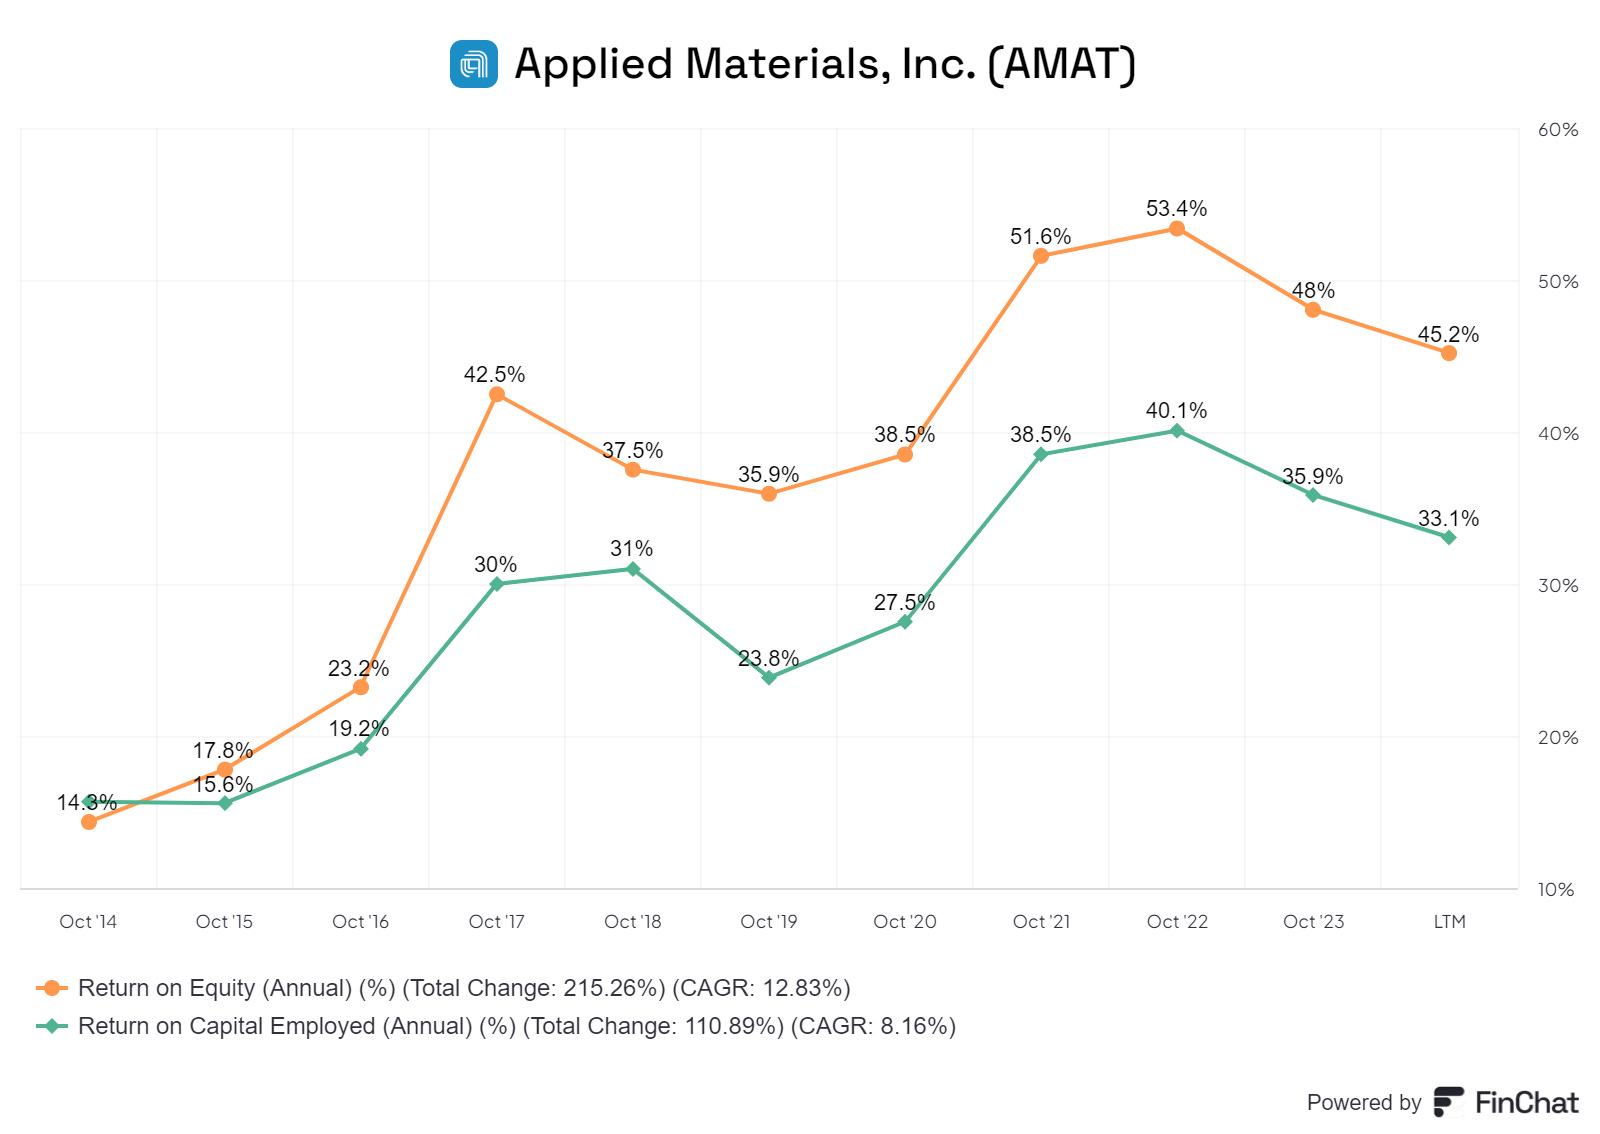
The company is quite profitable with an RoE of about 45.3% currently and RoCE of 33.1%.
Highlights from the most Recent Earnings call
“With Q2 revenue and earnings towards the high-end of our guided range, AMAT continues to deliver strong performance in 2024.”
“Semiconductors are the foundation of huge technology trends reshaping the global economy. These are driving demand for more chip manufacturing capacity, as well as better chips with higher performance and improved energy-efficiency.”
“Key inflections that underpin the semiconductor roadmap are enabled by Applied Materials. They will support our ongoing outperformance as next-generation chip technologies move into high-volume production.”
“In addition, the complexity of implementing the industry's roadmap and bringing new semiconductor technologies to market is driving earlier, deeper and broader collaboration with customers, as well as supporting double-digit growth for our service business. “
“AI will be the biggest technology inflection of our lifetimes. And at the heart of AI are some of the world's most sophisticated chips.”
“The advanced chips that power AI datacentres are enabled by four key semiconductor technologies:
1. Leading-edge logic; compute memory or high-performance DRAM;
2. DRAM stacking technology, referred to as high-bandwidth memory, or HBM;
3. Advanced packaging to connect the logic and
4. memory chips together and create a 'system in a package'.”
Applied claims it has process technology leadership in all four of these areas.
The company discussed their position in each of these segments.
LEADING EDGE LOGIC
“In advanced logic, Applied has long-standing leadership in the materials engineering processes for both transistors and interconnects. The first nodes that use GAA (gate-all-around transistors are now transitioning to high-volume manufacturing.”
In our notes on INTEL which can be seen here. We spent some time discussing Moore’s Law which was an observation made in 1965 that the power of computer chips doubles every two years. Moore’s Law has been an accurate predictor of the progress in development of chips in the last five decades.
The number of transistors in a chip has grown from 200 in 1965, when Moore’s law was first articulated, to 1000 in 1970, when the first microchip ( Intel 4004) was invented, to about 50bn in 2020 and reportedly 2.6 trillion today.
A more and more transistors were “packed” the size of the transistor must get smaller. The unit of measurement here is the nanometre (nm). A nanometre is one billionth of a meter (!), also expressed as 0.000000001 or 10-9 meters. The most advanced chips today are at 3-5nm.
In the last ten years people have been predicting the end of Moore’s Law. It is almost impossible to operate at such small sizes and the laws of physics dictate that further progress will be both difficult and very expensive. As device dimension shrinks, controlling the current flow becomes more difficult. Even when the Chip “gate” is turned off, because they are so close to each other, there is some electron “leakage” even though the gate is closed. Some experts argue leakage becomes an issue as you go below 28 nm.
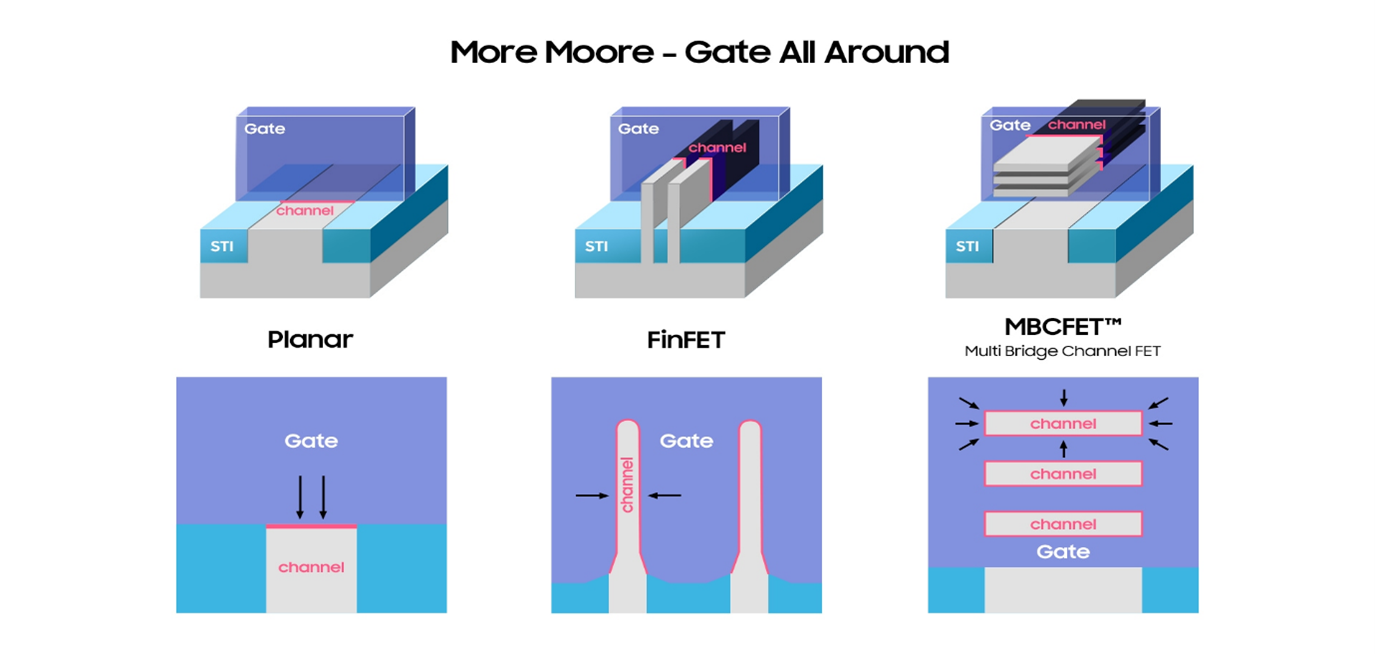
Chip designers have tried to change chip architecture to further boost performance. Until 2012, transistors were laid flat on the surface or plane of a semiconductor: that limited the number of transistors that could be packed in an area. This was called planar transistor architecture.
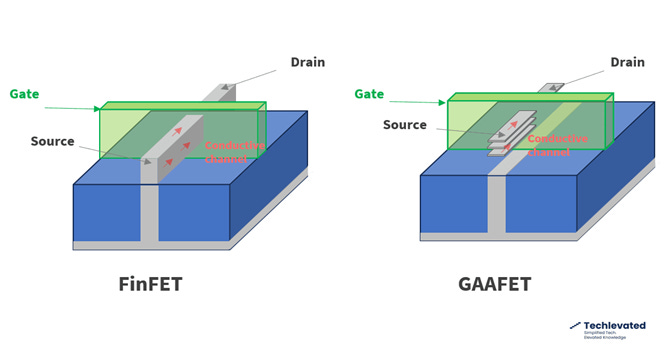
In 2016 , the FINFET 3d structure was devised and this was followed by Intel’s RibbonFet.
FINFET meaning? The device is the shape of a fin while FET stands of field effect transistor. A FINFET is a non-planar dual gate transistor. The YouTube video below gives more information on FINFET.
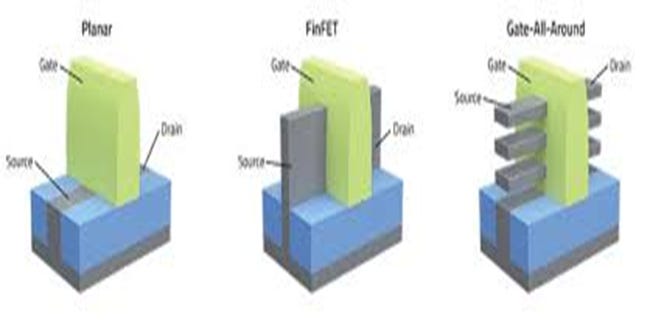
The diagram above illustrates different chip architectures. Each has a source and a drain which are separated by the gate. When the power is at the right voltage, the gate opens and allows a flow of electrons to go from the source to the drain
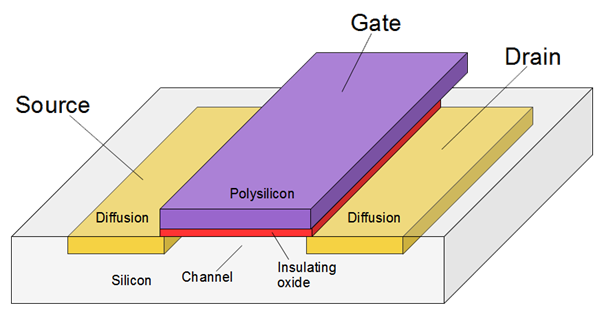
The ability to control the material’s ability to conduct such particles is called the field effect. It only conducts part of the time, hence the word “semi" in semiconductor.
Now Samsung, Intel and other are moving to the Gate-all-Around (GAA)architecture. This informative video gives some good information on GAA.
GAA takes the FinFET design and turns it sideways so that the channels are horizontal instead of vertical. Instead of surrounding the channel on three sides as in the FinFET architecture, GAA surrounds it on all four sides, to allow better control of the transistor switch.
AMAT believes the move to GAA will be beneficial for them
“GAA process flows are considerably more complex, and the shift from FinFET to GAA grows AMAT’s s available market from around $6 billion to approximately $7 billion for every 100,000 wafer starts per month of capacity.”
“With the GAA transition, we are also gaining share and we are on track to capture over 50% of the process equipment spending for transistor steps.”
GAA is already generating revenues for them
“Overall, we expect to generate more than $2.5 billion of revenue from GAA nodes this year and potentially more than double that in 2025.”
DRAM
In DRAM, one of the key approaches that memory makers are using to improve performance and power consumption is to implement logic technologies in the peripheral circuitry.
“Our deep capabilities in logic, combined with our strong position in DRAM patterning and our unique, co-optimized hard mask solutions for capacitor scaling, makes us the clear leader in process equipment for DRAM today and best positioned for future growth.”
In our note on Micron Technology, we discussed how DRAM manufacturers are focusing on the High-Bandwidth Memory (HBM) which is seeing a huge increase in demand as AI datacentres are being built.
“In the critical die-stacking technologies used in HBM, we also have strong leadership positions. Last quarter, we said that we expected our HBM packaging revenue to be 4 times larger in 2024 than in 2023.As we have recently seen customers accelerate their capacity plans for HBM, we now believe that our revenue could be 6 times higher this year, growing to more than $600 million.”
Advanced Packaging
“We now expect revenue from our advanced packaging product portfolio to grow to approximately $1.7 billion this year. Looking further ahead, we see opportunities for this business to double again, as heterogenous integration is more widely adopted, beyond the AI datacentre, and we introduce new products that expand our served market”
“As logic devices become more three dimensional, future generations of DRAM come to market and advanced packaging becomes more prevalent, we expect materials engineering to become an even larger portion of overall wafer fab equipment.”
Another key component of Applied’s strategy is to address the increasing complexity faced by the industry.
“First, we are driving earlier, deeper and broader collaboration with customers and partners. We are changing the industry's innovation model with the goal to accelerate mutual success rates and increase investment efficiencies. Our global EPIC platform, that we will build out over the next several years, is specifically designed to support high-velocity innovation and commercialization of next-generation technologies.”
“Second, we can provide more complete and connected solutions that accelerate major device inflections. The portion of our revenue generated by integrated solutions has grown from approximately 20% in 2019 to 30% today.”
“Third, we are helping customers transfer new technology into high-volume manufacturing faster and then optimize performance, yield, output and cost in their factory operations. This is supporting double-digit growth of our service business.”
Capital Allocation Strategy
Our efficient business model generates healthy free cash flow.
Our first priority is investing in R&D and capital infrastructure to enable profitable growth.
Our second priority is growing our dividend per share and using our buyback program to distribute excess free cash flow to shareholders.
Over the past 10 years, we have reinvested more than $20 billion in R&D and distributed more than 90% of free cash flow to shareholders.
We invest over $3 billion in R&D each year collaborating closely with our customers to invent new semiconductor technologies
We design high-volume manufacturing systems that enable our customers to deploy these new chip and advanced packaging technologies at global scale.
We manage a global factory and supply chain network to manufacture these systems.
Fourth, we service our systems which have decades of useful life helping customers maximize their return on investment by accelerating ramps and optimizing output, yield and cost.
Fifth, we reinvest a high percentage of the profits from this activity back into R&D to develop more new technologies and solutions
Finally, we distribute excess cash to shareholders.
Growth of Manufacturing creates greater services revenues.
An important point is that every tool we manufacture and ship grows our installed base and our service opportunity, which leads to consistent and stable growth for Applied Global Services.
In fact, AGS has delivered 19 consecutive quarters of year-over-year growth spanning two memory downcycles.
Over 80% of AGS revenue comes from recurring services and parts sales, about two-thirds of which is delivered under long-term service agreements that have a 90% renewal rate.
AGS has continued to produce more than enough operating profit to fully fund our growing dividend.
Segment Results
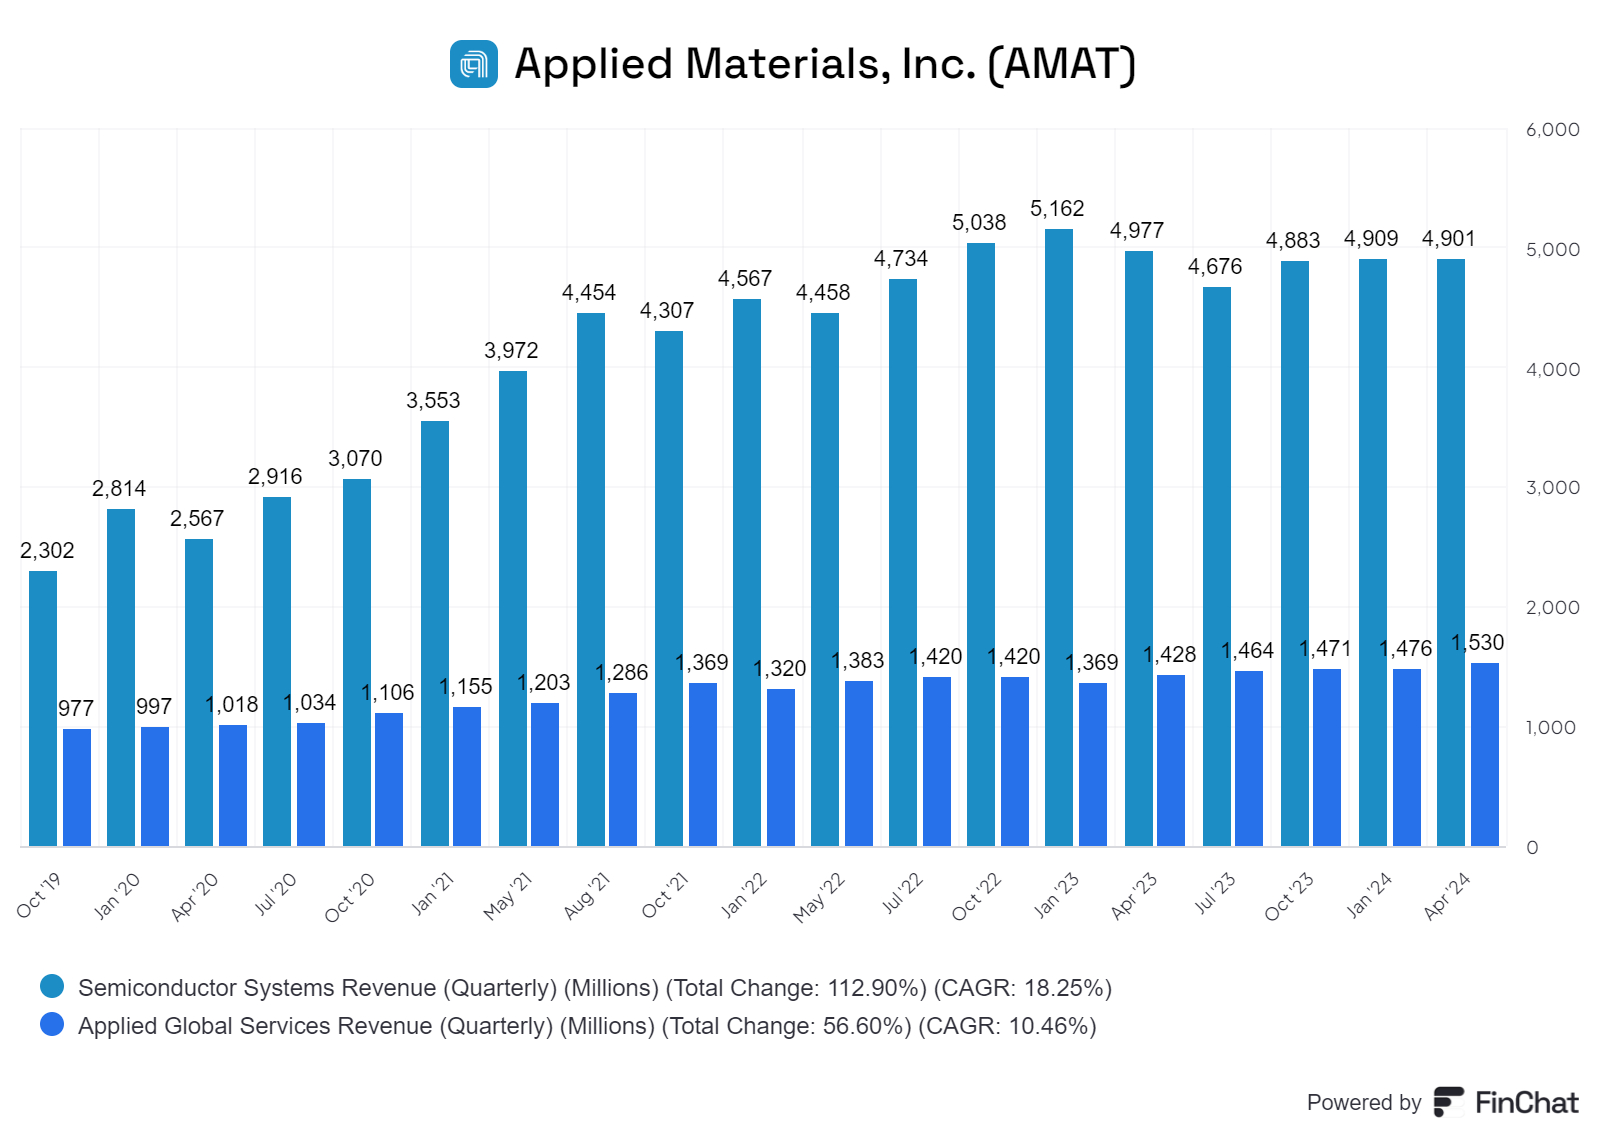
Turning to segment results, Semiconductor Systems revenue remained strong at $4.9 bn and included record ion implant sales. Segment non-GAAP operating margin was 34.9%.
Applied Global Services revenue increased 7% year-over-year to $1.53bn, and segment non-GAAP operating margin was 28.5%. This was the “19th consecutive quarters of revenue growth.”

Turning to cash flows, in Q2, AMAT generated $1.39bn in operating cash flow and $1.14bn in free cash flow.
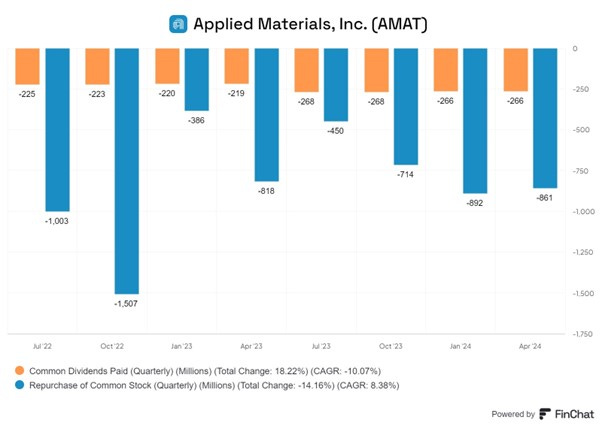
AMAT distributed nearly $1.1bn to shareholders, including $266 million in dividends and $820 million in buybacks.
Outlook
“Over many quarters or the next several years is that the leading-logic technologies like gate-all-around and backside power, the advanced packaging, HBM memory, our services business, we think all of those will grow faster than the average market and will help us gain share.”
“In DRAM, we gained 10 points of overall DRAM share over the last 10 years. And if I look forward at the architecture inflections in DRAM, we're even better positioned. Those will be much more materials-intensive, materials engineering-enabled, and that's going to be a really good position for us.”
“All of our customers are racing to be first to market to deliver those major device architecture inflections that determine their competitive position. So, gate-all-around, backside power, those new DRAM architectures and packaging is becoming more and more important to power performance and costs. So that is really what shapes the competitive landscape in the industry.”
“Moore's Law has slowed down significantly. This is another major driver of how the industry will innovate going forward. And with Applied, we have the broadest portfolio of technologies, PVD, CVD, CMP, plating, etch, we've added hybrid bonding, digital lithography, eBeam test. We have a very broad portfolio.”
“We have pretty good line of sight to what those inflections look like, the architecture inflections will look like in a very strong position to grow our share as those inflections come to market. We're not giving a specific timeframe on the doubling. It will happen over a number of years, but very, very optimistic about our opportunities in packaging.”
“The end markets are mixed. So, industrial and auto have been weaker. Smartphone, PC-related products have been slow, but gaining some strength recently. So, it's been mixed end markets, but the customers are investing for forward-looking demand and to get capacity in place for forward-looking demand.”
“We've seen the allocation to HBM from a wafer start perspective increase from 5% to probably something closer to 20%. That said, it's not 100% utilized. We have seen demand for HBM strengthening. We went from about 4x increase to 6x increase from the last time that we talked to you guys. And I would say that we still are seeing incremental demand going forward. So that pull is still there from customers. We're not giving any point estimate for next year, but we do continue to see stronger demand in that segment.”
SWOT Analysis
Strengths
Well established player in Chip manufacturing equipment supplier.
Covers a wide range of the stages of chip manufacturing beyond Lithography.
Works with all the key manufacturers such as Intel, TSMC, Samsung and many others.
It is an integral partner in new technology developments and works very closely
The large and growing installed base of machinery gives stable recurring revenue for the services business
There is a limited number of competitors- mainly KLA-Tencor and Lam Research .
Company is a consistent generator of FCF and 90% of it is returned to shareholders via dividends and share buy backs (latter are about 4% CAGR)
Weaknesses
As an equipment supplier to manufacturers, it is very strongly exposed to a downturn in demand for chips among end users.
A large part of the company’s demand has been in China and sales have been constrained to US limitation on semiconductor exports to China.
The business is capital intensive and require significant, ongoing capital expenditure well in advance of associated revenue gains
Opportunities
Inflection in technology relating to Chip architecture and products will create more opportunities for AMAT
Medium-term developments in AI, IoT, Automobiles, Industrial automation will boost demand for chips and for AMT’s products.
Threats
Competitors are large companies with a similar profile.
Investment in chip manufacturing many slow down significantly
Summary
AMAT is a well-established player in Chip manufacturing equipment .
Its machines/ products a wide range of the stages of chip manufacturing apart from Lithography.
The large and growing installed base of its machinery gives stable recurring revenue for the services business
Company is a consistent generator of FCF
90% of FCF is returned to shareholders via dividends and share buy backs (latter about 4% CAGR)
Company appears to be well placed to take advantage of Inflection in technology relating to Chips
Valuation
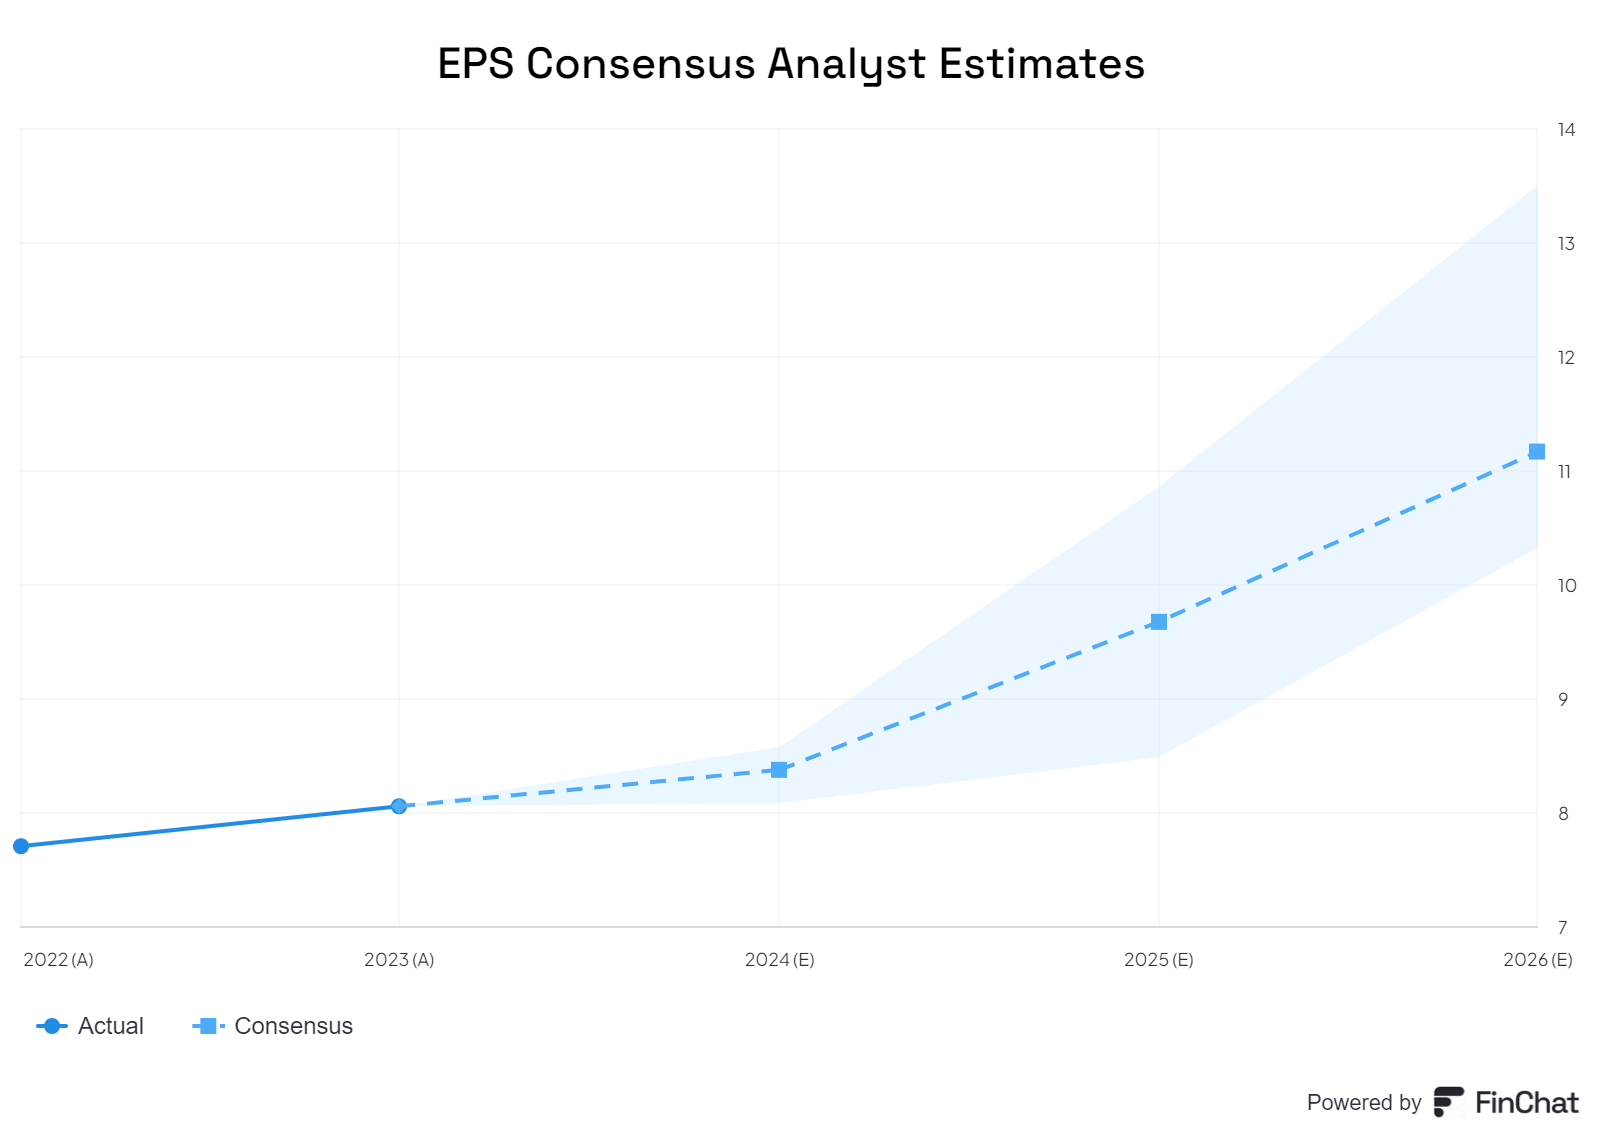
Chart above shown consensus analysts’ expectations of indicating strong growth in EPS in the next three years. This is based on analysts expectation of revenues, operating income, net profit, operating cash flow, free cash flow and EPS growth (shown in chart below)
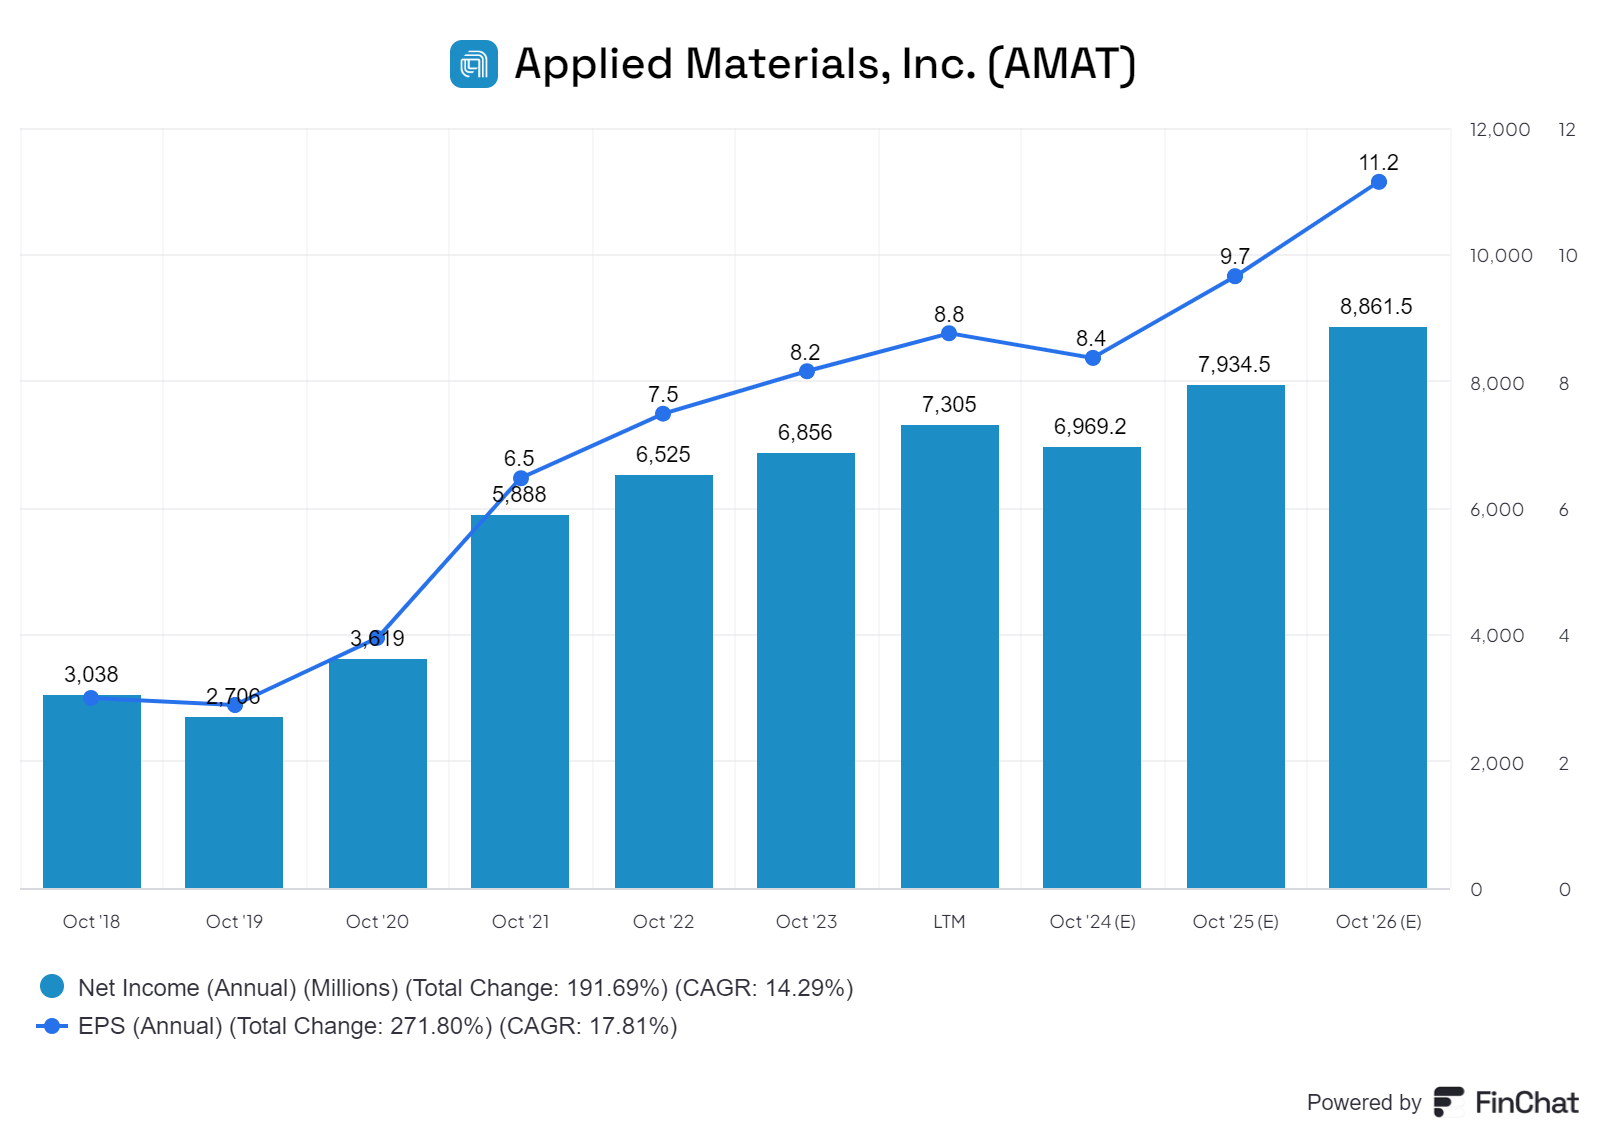
FY 2026 consensus EPS is $ 11.2. At the current share price of $ 248 this implies a simple forward PE multiple of 22.2X. This not too hig,h especially if one considers the high profitability of the company -RoE is 45%.
FY 2026 Free Cash Flow mean estimate is $ 7.97bn. At the current market cap of $200bn, it implies forward FCF yield of 4.0%
We ran a DCF model where we assumed that the analysts estimates are correct for FY24, FY 25 and FY 26. For the years FY 27 and FY 28, we assumed 10% earnings growth and a rise in Net margins to 30%.

We also assumed a WACC of 9.8% and an Exit P/E Multiple after five years of 30X. We thought this was a bullish set of assumptions
With these assumptions, we arrive at a fair value of the stock using a DCF of $ 236 per share compared with the current share price of $ 241.
We are surprised by the result and were frankly expecting to be higher given the optimistic assumptions.
We have checked our inputs and the calculation to see if an error has been made. We have not been able to find one. We need to spend some time to a more detailed DCF model.
Conclusion
AMAT is an interesting company which is likely to make good progress. We have decided to allocate a token 1% of our capital to AMAT. We need to get more comfortable with the valuation before we can consider adding more to the exposure.